The Decline of Prosperity:China's Economy Under Siege (Understanding This Can Benefit You for 30 Years)
This article comprehensively elucidates my views on China’s economy.
The full text is approximately 30,000 words, taking the author 14 months to write. Reading it requires 60 minutes. If fully understood, it can benefit for 30 years.
A person’s fate certainly depends on their own efforts, but one must also consider the course of history. Ordinary people like us cannot choose the era we live in, nor can we resist historical trends. The wheels of history roll on, and a speck of dust lifted by them can be a mountain for an individual, leading to disaster. Therefore, it is essential to see historical trends clearly and avoid pitfalls. If decision-makers can recognize the position of the economy within historical trends and implement appropriate policies while avoiding inappropriate ones, they can benefit the populace.
Introduction: Why Write This Article?
Through this article, I hope to address the following questions:
1. How did China’s economy fall into its current predicament?
2. How did inappropriate fiscal and monetary policies exacerbate economic decline?
3. Why is it said that China’s economy is already in a “besieged stage”?
4. What are the characteristics of this stage?
5. What impact does it have on the capital market?
6. How should the government delay the decline in investment returns?
7. How should ordinary people cope?
Since early 2022, China’s economy has rapidly fallen into a balance sheet recession, experiencing a downward deflationary spiral; the real estate market collapsed: prices plummeted, residents massively defaulted and abandoned mortgages, real estate companies teetered on the brink of bankruptcy, brewing financial risks; the number of bankruptcies across industries increased, unemployment rates rose significantly; and fiscal revenue growth declined.
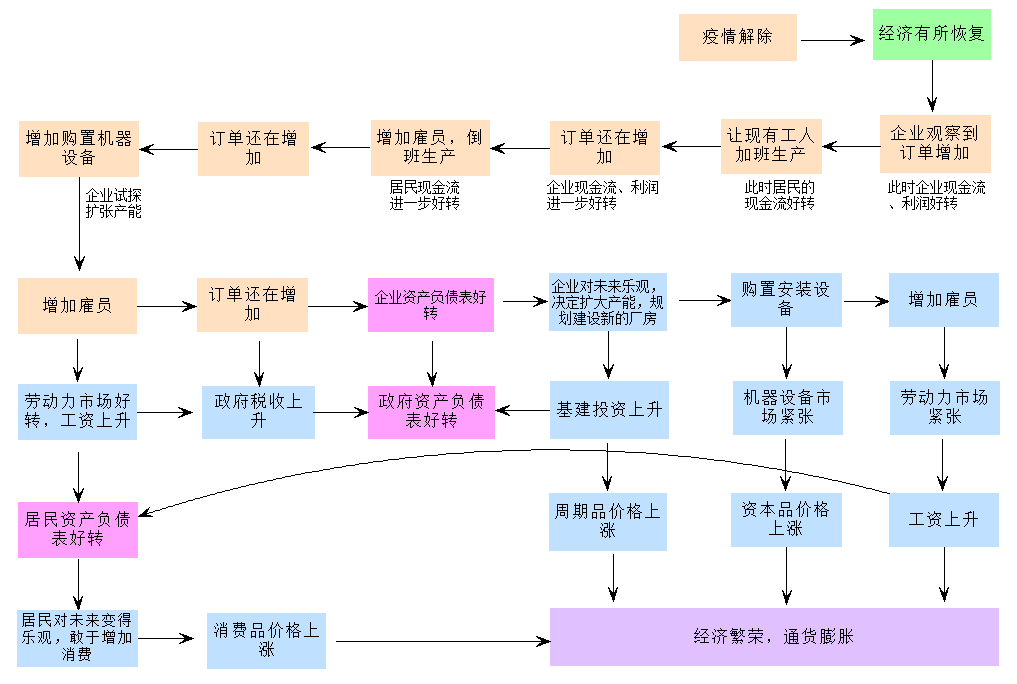
In the fourth quarter of 2022, the central government abandoned pandemic control policies and relaxed financing policies for real estate companies. Everyone expected a “revenge spending” spree, and the economy was anticipated to recover quickly. But things did not go as hoped. From early 2023 to now (July 2024), consumption growth has remained weak, business investment enthusiasm has remained low; the Producer Price Index (PPI) has continuously shown substantial negative growth, the Consumer Price Index (CPI) has hovered around zero, indicating a state of deflation; growth rates of M1, M2, social financing scale, and loan balances have hit new lows; the RMB exchange rate faces immense devaluation pressure; the effectiveness of monetary policy has diminished, and fiscal policy actions have been slow; currently, both central and local fiscal revenues are experiencing negative year-on-year growth, with the national tax department retrospectively auditing taxes to increase revenue; local governments are under immense debt pressure, incapable of investing in public welfare, resorting to pre-collecting excess taxes or increasing administrative penalties; real estate control policies have been completely lifted, and from May 17, 2024, attempts have been made to stimulate home purchases by lowering down payments and mortgage rates, but the results are uncertain; a pessimistic atmosphere permeates society, with an increase in suicides and violent incidents.
In summary, if before 2022, China’s economy was sailing on relatively calm waters, post-2022 it has been navigating through treacherous rapids and turbulent waters.
Facing such an economic predicament, various voices have emerged. Official media believe the key lies in the “lack of confidence” among residents and businesses but fail to explain why confidence is lacking; scholars within the system do not dare to acknowledge the occurrence of a “balance sheet recession” and “deflation,” and some “scholars” are even tasked with publishing articles in the media denying the existence of a “balance sheet recession,” which is utterly self-deceptive; chief economists of financial institutions are under strict regulation, unable to publicly mention sensitive words like “recession” and “deflation”; some fantasize about a new inventory cycle or capacity cycle starting soon, bringing a bull market to the stock market.
Academic circles do not offer correct insights on these issues, unknowingly relinquishing the discourse power to self-media authors who lack professional qualifications. To attract attention, these people fabricate views lacking common sense and logic, attach sensational titles, and spread them widely, directing hatred towards the financial industry, capital, and foreigners, misleading the public and inciting populism or even extreme nationalism. This is detrimental to solving economic problems.
Officials either lack a clear understanding of why the economy is in trouble, are muddled and ignorant; cling to outdated ideas, holding on to illusions; or are well aware but powerless. Without the correct understanding, correct decisions cannot be made. Some local officials think that residents don’t consume because they lack consumption scenarios and believe organizing barbecue festivals and night markets can stimulate consumption; local governments, to overcome fiscal difficulties, pre-collect excess taxes and fines, damaging the business environment, and raise utility prices; the central bank should significantly cut interest rates but hesitates, leading to high real interest rates; the central fiscal should quickly leverage up significantly but is cautious and hesitant; when vigorous consumption stimulation is needed, they think a little subsidy can drive durable goods purchases and equipment updates by residents and businesses.
Clearly, these approaches will only waste more time and take more detours. The crux of China’s economic problems must first be understood before remedies can be applied, avoiding wasted time, missed opportunities, and futile efforts.
In May 2023, I began to ponder why economic recovery was difficult, gradually shifting from analyzing issues with Keynesian and monetarist theories to using the real economic cycle theory. Following this approach perfectly explains all recent phenomena in China’s economy. Subsequently, I wrote a research report of over 100,000 words around this idea.
In early 2023, Gu Zhaoming’s new book “The Pursued Economy” was published in Chinese. I found that his concepts of “balance sheet recession” and “pursued economy” fit perfectly into my analytical framework. With my framework, these two economic phenomena are inevitably derived.
In mid-March 2023, I planned to compile these ideas and views into a book. However, subsequent family incidents forced me to run between hospitals daily, only managing to squeeze out fragmented time for research.
This article is a summary of the completed parts. Due to space limitations, it focuses on presenting views—the specific logic, data, charts, arguments, and references are all placed in underlined hyperlinks within the text for further viewing. There are still many issues awaiting in-depth discussion.
I. Macro-Economic Analysis Framework: Centered on TFP and Natural Interest Rate
(1) Analytical Framework
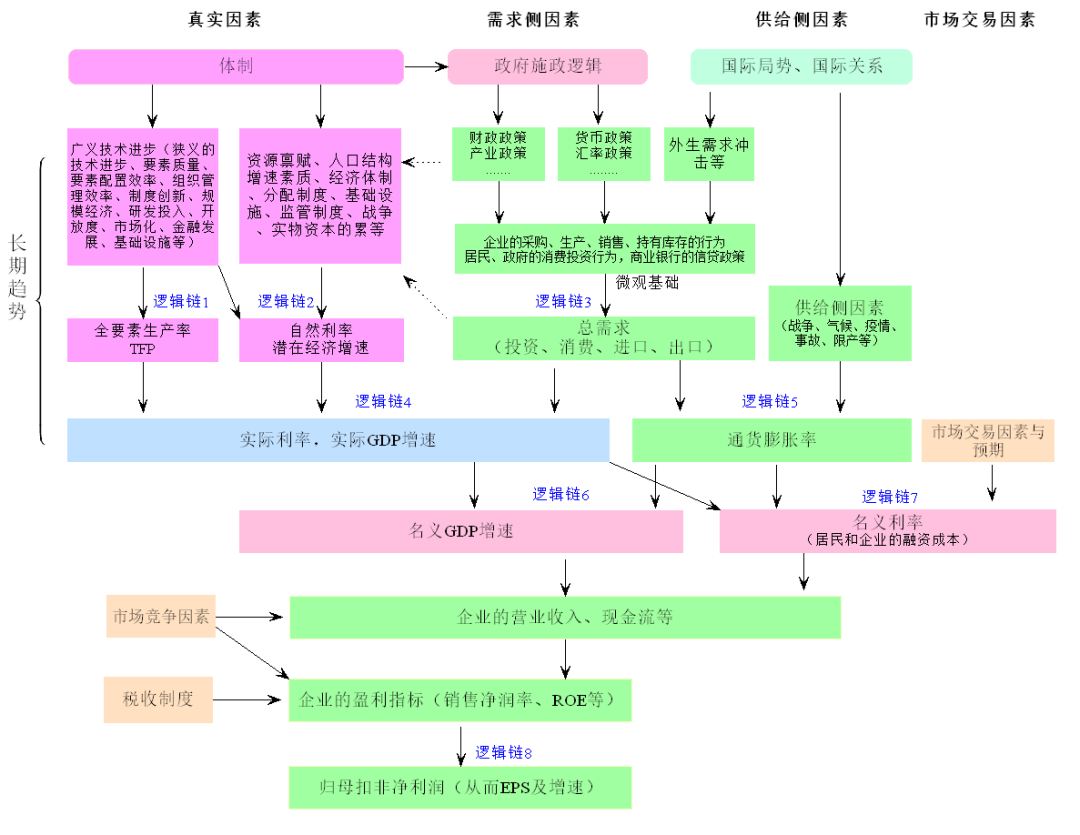
To clearly explain the issue, I first introduce my framework for analyzing China’s economy (Figure 1). Specifically:
Logic Chain 1: In the long run, broad technological progress (including narrow technological progress, factor quality, factor allocation efficiency, organizational management efficiency, institutional innovation, economies of scale, R&D investment, openness, marketization, financial development, infrastructure, etc.) determines Total Factor Productivity (TFP).
Logic Chain 2: In the long run, real factors in the economy (broad technological progress, resource endowment, population quantity and quality structure, economic system, distribution system, regulatory system, wars, capital accumulation, etc.) determine the natural interest rate and potential economic growth rate.
Logic Chain 3: In the short run, demand-side factors (fiscal policy, monetary policy, industrial policy, exogenous demand shocks, etc.) determine enterprises’ procurement, production, inventory holding, and sales behaviors, commercial banks’ credit policies, and residents’ and governments’ investment and consumption behaviors. These are the micro-foundations of macroeconomics. They further determine the short-term fluctuations of aggregate demand.
Logic Chain 4: Slow variables (TFP, natural interest rate) determine the long-term trends of actual interest rates and GDP in reality; short-term fast variables (aggregate demand) determine the short-term fluctuations of actual interest rates and GDP in reality.
Logic Chain 5: In the short run, supply-side factors (wars, climate, pandemics, accidents, production limits, etc.) together with aggregate demand determine the inflation rate.
Logic Chain 6: In the short run, actual interest rates, actual GDP growth rates, and inflation rates together determine the nominal GDP growth rate.
Logic Chain 7: In the short run, actual interest rates, inflation rates, market trading factors, and expectations together determine the nominal interest rate.
Logic Chain 8: The nominal GDP growth rate, nominal interest rate, market competition factors, etc., together determine the business revenue and cash flow situation of enterprises, which, in turn, along with the tax system, determine the profitability indicators of enterprises (net profit margin, ROE, etc.). This further determines the non-deductible net profit attributable to the parent company of enterprises, thus determining the EPS and EPS growth rate of enterprises.
These logic chains (transmission mechanisms) are academically impeccable; detailed discussions and analyses can be found here.
The characteristics of this analytical framework are:
1. Incorporating Real Factors into Analysis, Grasping the Essence of Economic Growth
Facing the chaos in China’s economy, some believe it is caused by weak aggregate demand, some think it is due to an unreasonable economic structure, and others believe it is due to a balance sheet recession. In my view, these are all surface phenomena.
The root causes are:
Delays in reform; the dual structure of state-owned and private enterprises distorts resource allocation, leading to inefficiency; lack of innovation capability; aging population and deteriorating demographic structure; rising factor costs; unbalanced regional and sectoral development; and so on. These collectively lead to a decline in the marginal return on investment in the real sector. To solve these problems, one must address the real factors to achieve a fundamental solution.
2. Focusing on total factor productivity and natural interest rates, with the marginal return on investment running throughout
In Figure 1, real factors determine TFP and natural interest rates, which in turn determine all rates of return in the economy (nominal interest rate, real interest rate, net profit margin of enterprises, ROE, etc.). The core is TFP and natural interest rates.
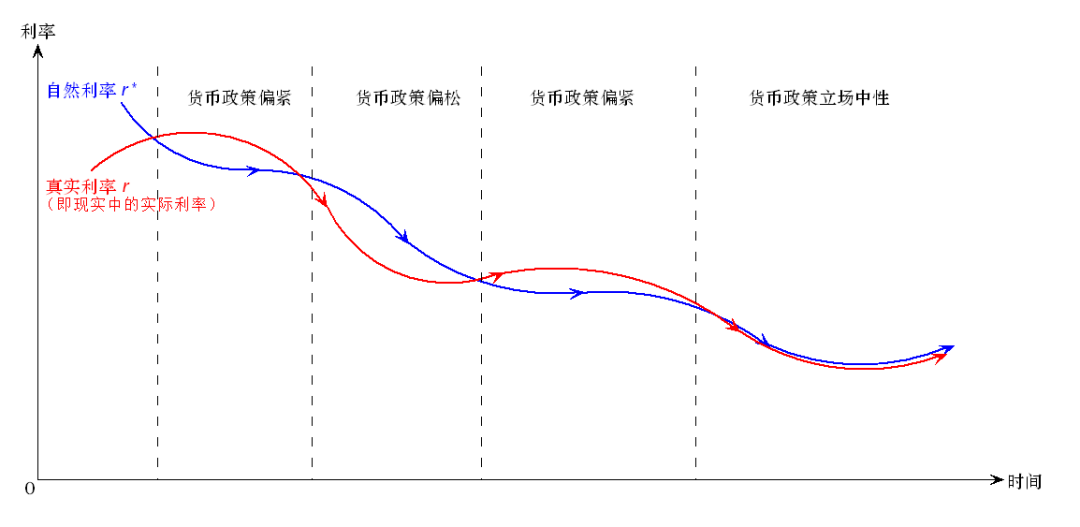
The natural interest rate is essentially the marginal return on investment of capital when the economy is in equilibrium, determined by real economic factors and unrelated to monetary policy itself and price factors.
The natural interest rate is a standard for measuring the looseness of monetary policy, or in other words, it is the anchor of monetary policy. If the natural interest rate is higher than the actual interest rate, monetary policy is tight; if the natural interest rate is lower than the actual interest rate, monetary policy is loose; if they are equal, monetary policy is neutral.
The entire analytical framework centers on total factor productivity and natural interest rates, whose changes determine all economic phenomena.
(2) The long-term trend of natural interest rates: from ancient times to the AI technological revolution
The long-term trend of the natural interest rate in a “typical” country can be as follows (click to see specific arguments):
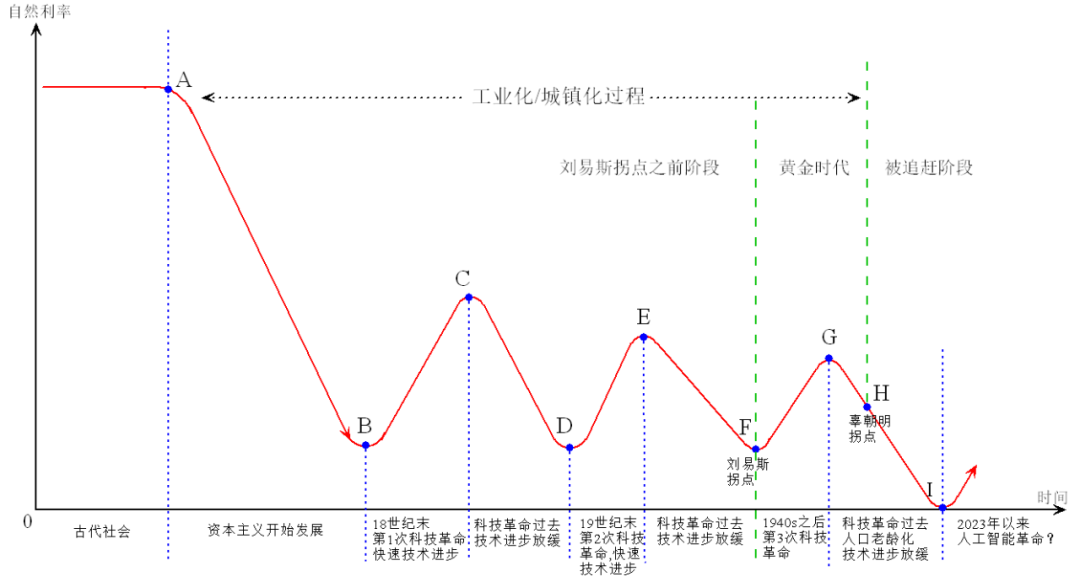
During the long feudal autocratic era, its natural interest rate was very high.
In the 17th century, it entered a capitalist society like Britain, and the market economy developed rapidly. At the same time, the process of industrialization/urbanization began, with a large number of surplus rural laborers starting to move to cities. With the development of capitalism, financial institutions, financial organizations, financial systems, and financial markets gradually improved, and the natural interest rate continued to decline.
By the end of the 18th century (point B in Figure 3), it began the first technological revolution like Britain and Western Europe, entering the steam age. Technological progress brought about a rapid increase in the return on investment, and the natural interest rate rebounded from point B to point C. This technological revolution ended in the 1840s, with machine-based mass production becoming common.
After the 1850s, as the steam revolution passed, technological progress slowed, the marginal return on investment declined, and the natural interest rate fell from point C to point D. This was the era in which Marx (1818-1883) and Engels (1820-1895) lived. They observed the decline in capitalists’ investment returns, regarded it as a general law of capitalism, and believed it was unsolvable. They observed the proletariat’s miserable situation and the widening wealth gap, believing this would inevitably provoke the proletariat’s resistance, and the capitalist system would inevitably perish. However, Richard Koo (2023) believes that the widening wealth gap is an inevitable phenomenon in the process of urbanization/industrialization before crossing the Lewis turning point (point F).
By the end of the 19th century, it began the second technological revolution (the electrical revolution) like the United States and Western Europe. This technological progress brought about an increase in the return on investment, and the natural interest rate rebounded again, from point D to point E. This was the era in which Schumpeter (1883-1950) lived, who observed the great improvement in productivity brought about by innovation and thus highly praised the role of innovation, theorizing it.
After World War II, around 1950, this economy began the third technological revolution (nuclear energy, computers, space technology, bioengineering, etc.) like the United States. Technological progress caused the natural interest rate to rebound from point F to point G. By the 1960s, the speed of technological progress gradually slowed, and the natural interest rate began to decline from point G.
By the 1970s, like the United States, the speed of technological progress slowed, factor costs rose, and the demographic dividend disappeared, causing the natural interest rate to decline. Subsequently, the 2008 financial crisis and the 2020 pandemic further lowered its natural interest rate, approaching zero or even negative values.
From the end of 2022 to the beginning of 2023, breakthroughs in artificial intelligence technology were regarded as a new technological revolution that could bring about an increase in productivity. If this is indeed the case, the natural interest rate will rebound from point I, but this is currently uncertain.
Figure 3 represents a typical economy. In reality, every economy can find its stage in Figure 3. So far, academic literature reveals that since the 1960s, the natural interest rate in the United States and Canada, the Eurozone since the 1970s, Japan since the 1980s, South Korea since the 1990s, and China and other countries since the 2000s has been generally declining. The reason is that they are studying the stage after the third technological revolution when technological progress has slowed.
The trend of the natural output (potential GDP) growth rate is basically the same as the trend of the natural interest rate.
Figure 3 also shows that the rise and fall stages of the natural interest rate last a long time, longer than a person’s lifetime. The government (policymakers) can determine some real factors, such as improving the natural interest rate through institutional reforms, infrastructure construction, encouraging innovation and technological progress, and delaying its decline, but it is difficult to reverse its long-term downward trend. It is even harder for individuals to resist its long-term downward trend.
The saying, “A person’s fate is determined by their own struggle, but also by the historical process.” fits perfectly here. We ordinary people cannot choose the era we live in, nor can we resist historical trends. The wheels of history roll on, and the dust they stir up can be a mountain for an individual, leading to a disaster. Therefore, it is necessary to see the historical trend clearly and avoid pitfalls. If policymakers can recognize the economic position and implement appropriate policies, avoiding bad policies, they can benefit the people greatly.
(3) Richard Koo’s theory as part of the above analytical framework and its inevitable result
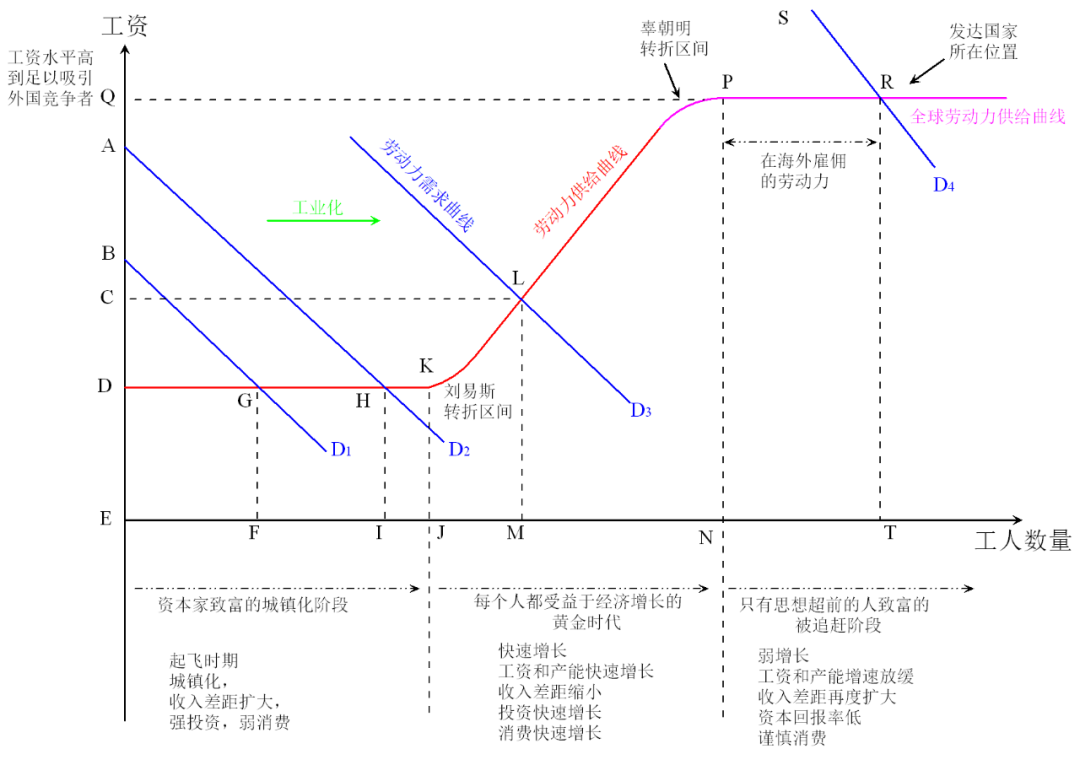
Richard Koo (2008, 2023) proposed concepts such as “balance sheet recession” and “pursued economy.” In Koo (2023), he expanded William A. Lewis’ (1954) “dual economy” development theory and proposed the concept of “pursued economy,” dividing the process of industrialization/urbanization into three stages:
1. “Urbanization stage” before the Lewis turning point
Before the economy reaches the Lewis turning point (point F in Figure 3, point K in Figure 4), there is an unlimited supply of rural labor, but wages do not rise. In this stage, the growth rate of total remuneration obtained by manufacturers far exceeds that obtained by labor. Since the number of manufacturers is far less than the number of workers, manufacturers quickly complete capital accumulation, while workers can only maintain a low income level, with limited consumption capacity, and the wealth gap widens, exacerbating income inequality.
2. “Golden age” after crossing the Lewis turning point
After crossing the Lewis turning point, enterprises have to raise wages to expand reproduction, leading to an increase in residents’ income and consumption capacity, and the wealth gap narrows. Everyone benefits from economic growth, even those with low education and lack of skills can easily find jobs, investment, and consumption are strong, and people are very optimistic about the future. Therefore, Koo calls this stage the “golden age.”
In this stage, due to strong demand for loans from enterprises and residents, it is easy to push up the money multiplier, making monetary policy very effective, and inflation is likely to occur. Fiscal policy is limited as it crowds out private sector investment, and only in the case of a balance sheet recession is fiscal policy more effective than monetary policy.
3. “Pursued stage”
As domestic labor is gradually absorbed, wages rise, leading to increased production costs and decreased profit margins for enterprises. Corresponding to point H in Figure 3, the natural interest rate decreases. In contrast, some later-developing economies with a large amount of surplus labor, low wages, and other factor prices have high investment returns. Therefore, enterprises begin to “go abroad” to invest in backward countries.
On the one hand, this leads to a slowdown in domestic economic growth and a decline in consumption growth, and only those with creativity and the ability to learn can earn high incomes, while those who cannot adapt (especially manufacturing workers replaced by competitors from other countries) will lose their jobs, widening the wealth gap again. On the other hand, it will drive the economies of backward countries to start taking off, catching up with advanced countries. Therefore, Koo calls this stage the “pursued stage.” In Figure 4, this is shown as the labor demand curve shifting to D4, intersecting with the horizontal “global labor supply curve” at point R.
For convenience, I refer to point P in Figure 4 as the “Koo turning point,” analogous to the “Lewis turning point.”
When an economy is in the “catch-up phase,” there is a lack of domestic investment opportunities, low corporate financing willingness, and low consumer spending willingness. In other words, domestic savings exceed investments, interest rates fall, and even very low interest rates fail to attract investments, greatly diminishing the effectiveness of monetary policy. At this point, fiscal policy will not crowd out private sector investments, making it more effective. This is especially true if a balance sheet recession occurs.
Richard Koo did not delve into the roots of an economy falling into a “balance sheet recession” and the “catch-up phase.” Figure 3 has shown my view, which is that the root cause is a decline in the return on investment due to real factors. For instance, in Figure 3, when the natural interest rate drops to point H, the domestic return on investment falls, and there is a lack of low-cost labor, making domestic investment unprofitable for enterprises, who then opt to invest abroad, leading to the hollowing out of the domestic manufacturing sector. It is precisely because of the decline in the return on investment that the economy is particularly prone to a “balance sheet recession” (see below for more details).
Taking China as an example:
After 1978, real factors such as the institutional dividends released by institutional changes, low-cost factors, learning foreign technology and management experience, substantial factor input, and the development of human capital collectively brought about broad-based technological progress. This led to an increase in TFP growth rate, potential GDP growth rate, and natural interest rate, subsequently resulting in a rise in actual GDP growth rate and a high return on investment. This process is also the industrialization process, and the process of continuous migration of surplus rural labor to the industrial sector, promoting urbanization.
However, after 2008, the TFP growth rate dropped to near zero; since 2000, the natural interest rate has been declining; after 2010, the potential GDP growth rate gradually declined, eventually leading to a drop in the actual GDP growth rate and marginal return rate. Between 2004 and 2012, the demographic dividend gradually disappeared, crossing the “Lewis Turning Point,” and labor costs began to rise rapidly.
From 2010 to 2021, although the natural interest rate and potential GDP growth rate were declining, the decline was relatively slow. Due to the pull of real estate, infrastructure, exports, and the rise of emerging industries, the GDP growth rate remained relatively high, and workers’ wages rose. This is the “golden age” mentioned by Richard Koo (2023).
However, the lockdowns in 2022 severely suppressed China’s TFP growth rate, natural interest rate, and potential GDP growth rate, causing the economy to fall into a balance sheet recession. Combined with an aging population, the marginal return on investment fell rapidly, forcing enterprises to accelerate their overseas expansion, leading the economy to cross the “Koo’s turning point” and enter the “catch-up phase,” or rather into the “besieged stage” with containment from the US, Japan, and Europe ahead, and pursuers from Southeast Asia, South Asia, and Latin America behind.
In other words, Richard Koo only pointed out the phenomena of “balance sheet recession” and “catch-up economy” without delving into their roots. According to my framework, adhering to the real business cycle theory, as the return on investment determined by real factors declines to a certain extent, the economy inevitably falls into a “balance sheet recession” or enters the “catch-up phase.” In this way, Koo’s paradigm becomes part of my analytical framework, and “balance sheet recession” and “catch-up economy” become inevitable results of my analytical framework.
2. How Did China’s Economy Fall into Its Current Plight?
(1) Strict Lockdowns in 2022 Suppressed the Natural Interest Rate and Natural Output
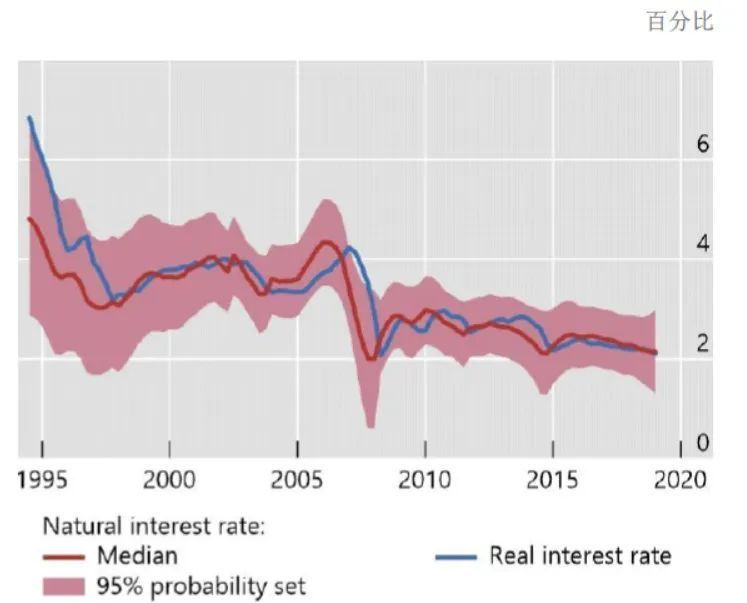
Before 2020, China’s natural output (potential GDP) growth rate was about 6%. According to the estimates of Sun Guofeng and Rees (2021), China’s natural interest rate was about 4% in the early 2000s, dropping to about 2% by the end of 2019.
In the first quarter of 2020, China’s economy was briefly affected by the pandemic. By May 2020, the pandemic was under control, and the economy had largely returned to normal. Subsequently, as Europe and the US fell into the pandemic, economic activities were halted, supply chains were disrupted, and demand for Chinese goods increased significantly, leading to a substantial rise in Chinese exports. As a result, until the end of 2021, China’s economic growth was still quite good.
However, at the beginning of 2022, as the economies of Europe and the US gradually normalized, demand for Chinese goods decreased. At the same time, Omicron began to spread in China. Faced with this highly contagious but less virulent variant, China did not relax its lockdown policies in time but instead imposed stricter lockdowns. Various regions implemented strict, long-term lockdowns, suppressing the TFP growth rate, natural interest rate, and natural output growth rate. The main transmission mechanisms include:
1. The hysteresis effect leading to a decline in corporate investment and R&D expenditure.
2. Significant human, material, and financial resources invested in pandemic prevention, reducing factors available for production and R&D.
3. Slowed technological progress.
4. Pandemic prevention leading to a decline in total factor productivity.
5. A decline in residents’ marginal propensity to consume.
6. A decline in the working population during the pandemic, accelerated aging, and increased low birth rates.
7. A decline in labor force participation rate.
These transmission mechanisms, similar to those during the 2008 financial crisis, caused TFP growth rate, natural interest rate, and potential GDP growth rate to take a step down. By July 2023, I believe that China’s natural output growth rate had already fallen to about 5%, and the natural interest rate had been suppressed to 1.5% or even lower.
Thus, since 2022, the economy has fallen into a “balance sheet recession,” with a decline in corporate marginal investment propensity, residents’ marginal consumption propensity, continued aging, slowing technological progress, and the persistence of low efficiency due to state-owned enterprises’ predominance over private enterprises, resulting in a continued decline in natural output growth rate and natural interest rate.
(2) Strict Lockdowns and Industry Rectification Policies Have Raised the Natural Unemployment Rate
Since 2020, especially since 2022, the pandemic, lockdown policies, and the hysteresis effect have also raised China’s natural unemployment rate. The transmission mechanisms are as follows:
1. Pandemic lockdowns leading to poor mobility and information flow, increasing frictional unemployment.
2. Changes in industrial structure and technological progress during the pandemic causing some people to lose their jobs.
3. Implementation of industry rectification policies, including:
The rectification of the platform economy since 2020, which concluded with the Politburo meeting on April 29, 2022.
The rectification of the education and training industry since 2021, which concluded in 2022.
The introduction of the “three red lines” policy by the central bank and financial regulatory authorities in August 2020, restricting real estate financing. This led to many real estate companies being unable to secure financing and on the verge of bankruptcy, necessitating the relaxation of financing restrictions after October 2022. Simultaneously, the lack of timely relaxation of purchase and loan restrictions caused house prices to plummet, residents’ assets to shrink, and balance sheets to deteriorate, which wasn’t largely relaxed until May 17, 2024.
The rectification of the financial industry starting in 2023.
Some of these rectification policies have a populist flavor. Overregulation of the real estate sector without timely adjustment compounded the impact of the pandemic, hitting these industries with a double blow. In the context of overall industry contraction and poor labor mobility, it is difficult for the unemployed with specialized skills to find reemployment, increasing structural unemployment.
4. Rational choices by enterprises (previous graduate dilemma)
The pandemic made it difficult for recent graduates to find jobs, leading to unemployment immediately after graduation and forcing them to rely on their families, pursue further education, or seek government jobs. After the pandemic, it will be exponentially more challenging for them to find jobs matching their qualifications. Enterprises will doubt their capabilities, and they will have no relevant work experience, making them only suitable for entry-level positions but with some social experience, making them less manageable than fresh graduates. This is the most rational choice for enterprises, but objectively, it leads to increased structural unemployment.
5. Hysteresis effect.
The pandemic causing short-term economic fluctuations leads to labor unemployment, impacting their work willingness and possibly causing a loss of job skills, making reemployment difficult and resulting in permanent exit from the labor market. Hence, the natural unemployment rate rises.
The natural unemployment rate has continued to rise, likely still increasing. In July 2023, the National Bureau of Statistics reported that the surveyed urban youth unemployment rate for ages 16-24 was as high as 21.3% in June 2023. Starting from August 2023, this data was no longer published, and the statistical scope was adjusted. From January 2024, the surveyed unemployment rate for urban youth aged 16-24 (excluding students) was published, In December 2023, it was 14.9%, and in May 2024, it was 14.2%. From a grassroots perspective, the actual situation is certainly more severe.
Since the natural unemployment rate is rising, it is difficult to reduce it through demand expansion. Of course, demand is also hard to expand.
(3) The strict lockdowns in 2022 damaged the balance sheets of various economic entities
1. Non-financial enterprises actively shrink their balance sheets
In 2022, long-term large-scale lockdowns across the country turned regions into economic islands, supply chains were disrupted, cash flows of enterprises were affected, revenue and profit growth slowed down, and leverage ratios increased. Although the dynamic zero-COVID policy was abandoned at the end of 2022, pessimistic expectations combined with a negative year-on-year PPI led to a hard-to-reverse decline in enterprise revenue and profit growth. Enterprises found their revenue and profit growth declining, inventories depreciating, and assets shrinking, while liabilities did not decrease, thus deteriorating their balance sheets. Enterprises were forced to shrink their balance sheets, repay loans, reduce investment and financing, and prepare for tough times.
Even some high-tech enterprises experienced layoffs and closures, which undoubtedly slows down the pace of technological progress in China, planting the seeds for further declines in total factor productivity, natural interest rates, and potential GDP growth in the future.
2. Residents’ assets shrink, actively reduce consumption
In 2022, long-term large-scale lockdowns across the country led to a decline in residents’ income, with no end to the pandemic in sight, gradually forming pessimistic expectations; combined with the sharp fall in house prices, stock markets, and funds, residents’ assets shrank while liabilities remained unchanged, thus deteriorating their balance sheets. Hence, residents actively reduced consumption, repaid debts, and sought to minimize liabilities.
3. Government finances are tight, willing but unable
In June 2023, when analyzing why investment and consumption recovery were slow, I believed that the Chinese economy was in the green box in the upper right corner of Figure 6. Without strong policy coordination, relying solely on the economy to self-adjust and then recover is a very long process that can be interrupted by various factors at any time, leading to a halt in recovery.
In summary, since 2022, the Chinese economy has undergone a severe “balance sheet recession” and has simultaneously entered the “fighting on all fronts stage.” Strong stimulus policies must be quickly implemented:
Central government finances should actively leverage up, expand central government finances, and replace local government finances, enterprises, and residents in driving the economy.
Focus on stimulating consumption, directly improving residents’ financial statements to stimulate consumption. It is recommended that the central government directly give cash to low- and middle-income families with high marginal propensity to consume and meet specific conditions, substantially reduce taxes, and lower mortgage rates on existing housing loans. Rather than merely giving consumers tax breaks or small subsidies for purchasing durable goods, or issuing a few yuan of consumption vouchers, which is meaningless.
Directly improve the financial statements of enterprises and reverse their expectations. Lower entry barriers in some industries to attract private capital investment; continue to improve the financing environment for tech companies, etc.
Coordinate monetary policy and significantly lower the LPR rate.
Unfortunately, the central bank and finance departments have been slow to react, leading the economy to remain in the green box in the upper right corner of Figure 6.
3. The Chinese economy entered the “fighting on all fronts stage” in 2022
Figures 3 and 4 show the economic development processes of “typical” countries. According to Koo’s (2023) viewpoint, the United States crossed the Lewis turning point in 1947, entering the “Golden Age”; in the 1970s, it crossed the “Koo turning point,” entering the “catch-up stage,” chased by Japan.
Japan was in the “Golden Age” from the mid-1960s to the mid-1990s, lasting 30 years. After the mid-1990s, it entered the third stage, chased by South Korea, Taiwan, and mainland China.
South Korea and Taiwan crossed the Lewis turning point in 1985. From 1985 to 2005, they were in the second stage “Golden Age,” lasting 20 years. In 2005, they entered the “catch-up stage,” chased by mainland China.
Koo’s division of these time points is clearly based on academic research. For example, Minami (1968) argued that Japan reached the Lewis turning point around 1960.
For China, Koo (2023, p.105) believes that before 2012, China was in the first stage and crossed the Lewis turning point in 2012, entering the “Golden Age.” He believes that China is currently still in the “Golden Age.”
I believe that the Chinese economy likely entered the “catch-up stage” from 2022, starting to be chased by Southeast Asian countries and even Latin American countries. The specific arguments can be found here. Generally speaking:
First, in 2022, China’s natural interest rate had fallen to levels similar to the U.S. in 1970 and Japan in the mid-1990s.
Second, China’s investment return rate is already lower than that of potential competitors.
Third, starting in 2022, enterprises have been forced to accelerate their “going abroad.”
Since 2022, entrepreneurs have generally realized that:
[1] In the context of East-West confrontation, de-globalization is intensifying, with the U.S. and Europe accelerating the cultivation of supply chains in Southeast Asia and Latin America to replace Chinese enterprises;
[2] Domestic investment returns have severely declined. Going abroad has become an inevitable choice for many enterprises to save themselves and survive. Chinese enterprises going abroad to build factories in Southeast Asia, Latin America, and even Africa means that the economies of these regions will take off. In fact, the GDP growth rates of many countries in Southeast Asia, India, and Africa have already far exceeded China’s. As long as there is demand, their supply chains will gradually improve and gradually replace China. Vietnam, Thailand, Laos, Myanmar, Indonesia, India, and other countries will become China’s main chasers.
Fourth, China entered a balance sheet recession in 2022, driving China into the “catch-up stage.”
In summary, the strict lockdowns in 2022 led to China entering a balance sheet recession on the one hand, and on the other hand, lowered China’s potential GDP growth rate and natural interest rate, significantly reducing China’s investment return rate, causing China to cross the “Koo turning point” in 2022 and enter the “catch-up stage.”
China’s “catch-up stage” is completely different from that of the U.S., Japan, South Korea, etc. The main difference lies in the severe hostility from the U.S., UK, Canada, Australia, Europe, and India towards China, trying to comprehensively squeeze and contain China in technology, trade, supply chains, international politics, and military aspects; and attempting to support Southeast Asia, India, and Mexico to build new supply chains to replace China’s supply chains.
In other words, China faces a situation of being besieged from the front and chased from the back, fighting on all fronts.
Therefore, I prefer to call it the “fighting on all fronts stage.”
IV. The Central Bank Did Not Cut Interest Rates in Time, Leading to High Real Interest Rates and Amplifying Economic Fluctuations
(i) The Central Bank Erroneously Adhered to the So-called “Golden Rule,” Cutting the Mark to Fit the Boat
As mentioned earlier, the pandemic, lockdown policies, and lag effects since 2022 have depressed China’s natural interest rate and natural output. At the end of 2019, China’s natural output growth rate was just over 6%, which dropped to around 5% in 2022. At the end of 2019, the natural interest rate was about 2% (Sun Guofeng and Rees, 2021), and by 2022, it likely dropped to 1.5% or even lower.
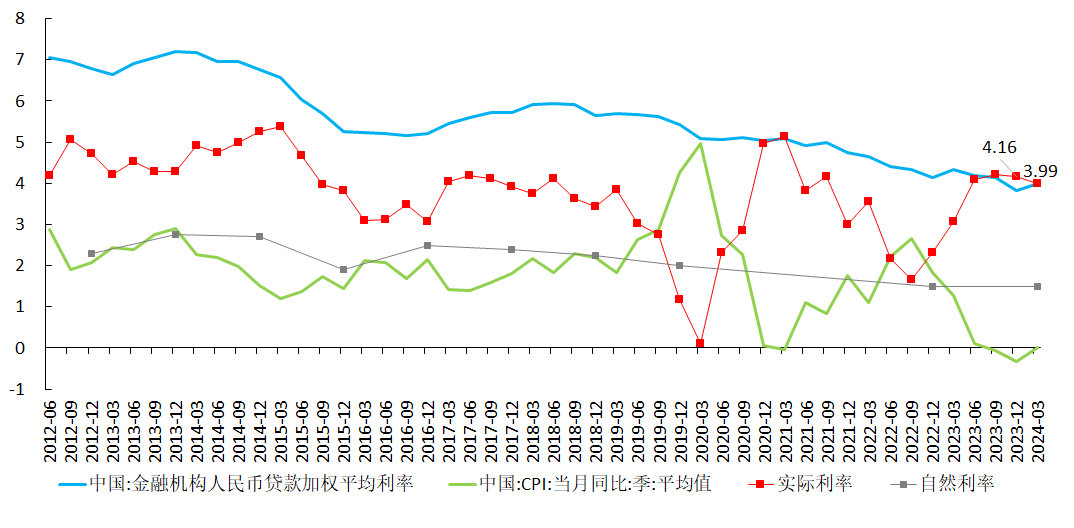
Since 2022, China’s economy has been in serious deflation, with real interest rates above 4%. Real interest rates higher than the natural interest rate mean that monetary policy is tight and nominal interest rates (LPR) need to be significantly reduced to bring real interest rates below the natural rate.
However, at that time, the central bank adhered to the so-called “Golden Rule,” which equates real interest rates with potential GDP growth. Then Central Bank Governor Yi Gang (2021, 2023) repeatedly explained why the “Golden Rule” should be followed. He believed:
“Theoretically, the natural interest rate is the real interest rate level when the macroeconomic total supply and demand reach equilibrium… In the long term, the macro interest rate level should match the natural interest rate. Since the natural interest rate is an abstract theoretical concept with a specific level that is difficult to estimate, in practice, the ‘Golden Rule’ is generally used to measure a reasonable interest rate level. This means that when the economy is on a steady growth path that maximizes per capita consumption, the inflation-adjusted real interest rate r should equal the real economic growth rate g.
If r continues to be higher than g, it will lead to high social financing costs, making it difficult for enterprises to operate, which is not conducive to economic development. When r is lower than g, the nominal interest rate is often lower than the nominal GDP growth rate, which is conducive to debt sustainability, meaning that the debt leverage ratio remains stable or declines, giving the government some extra policy space… Generally, r slightly lower than g is reasonable. Experience data shows that most of the time in China, the real interest rate is lower than the actual economic growth rate, which can be considered an optimal strategy with room for maneuver. However, r should not be significantly lower than g for a long time. If the interest rate is too low for a long period, it will distort the allocation of financial resources, leading to over-investment, excess capacity, inflation, asset price bubbles, and fund idling. Ultra-low interest rate policies cannot be sustained for a long time.”
At that time, the central bank’s interest rate policy followed this approach. For example, the central bank’s “Monetary Policy Implementation Report” on May 25, 2023, expressed the same idea. Until 2023, Yi Gang (2023) still insisted:
“In economic theory, we generally refer to the Taylor Rule and the Golden Rule to measure appropriate interest rate levels. The Taylor Rule emphasizes short-term countercyclical adjustments, while the Golden Rule (Phelps, 1961) explains an optimal path of savings and investment, where consumption is also continuously satisfied, thus optimizing the utility function. The Golden Rule is the optimal solution for long-term steady-state growth. It suggests that the real interest rate should be approximately equal to the potential growth rate, and too low or too high an interest rate will have adverse consequences. The Golden Rule is not very instructive for short-term monetary policy operations, but it is meaningful for longer-term time series verification. The Golden Rule can provide a measure of the optimal long-term growth trajectory.”
In July 2023, I wrote that the “Golden Rule” is derived from a very simple model under a series of assumptions. These assumptions include:
[1] The economy is perfectly competitive;
[2] Technological progress is exogenous and entirely labor-augmenting;
[3] There are no externalities;
[4] The production function exhibits constant returns to scale;
[5] The labor supply is inelastic, with the total labor force growing at an exogenous rate γ.
However, these conditions are impossible to meet in reality.
[1] China’s economy is clearly not perfectly competitive, with the dual structure of state-owned and private enterprises always putting private enterprises at a disadvantage. Since the supply-side structural reforms began in 2016, industry concentration has increased, and technological progress is not exogenous.
[2] Almost all papers studying China’s technological progress point out that it is not entirely labor-augmenting. Most studies find that China’s technological progress is labor-augmenting to some extent, similar to the United States.
[3] Externalities cannot be absent in the economy;
[4] The production function obviously does not exhibit constant returns to scale.
[5] The labor supply is not inelastic, especially since China crossed the “Lewis Turning Point” in 2012, with labor shortages becoming increasingly serious.
In short, the premise of the “Golden Rule” is not valid. Therefore, in reality, the “Golden Rule” cannot hold.
Even if we take a step back, the “Golden Rule” states that “the real interest rate is approximately equal to the potential GDP growth rate.” As CPI is constantly changing, according to the “Golden Rule,” the nominal interest rate should be adjusted according to CPI to keep the real interest rate relatively stable.
After the third quarter of 2022, as the economy weakened and CPI dropped rapidly, nominal interest rates declined slowly, and real interest rates rose quickly (the red line in Figure 7), far exceeding the natural interest rate. This indicates that monetary policy was actually tightening. Therefore, even according to the “Golden Rule,” nominal interest rates should be significantly reduced to bring real interest rates below 2%.
(ii) Failing to Cut Interest Rates Significantly When Necessary, Artificially Amplifying Economic Fluctuations
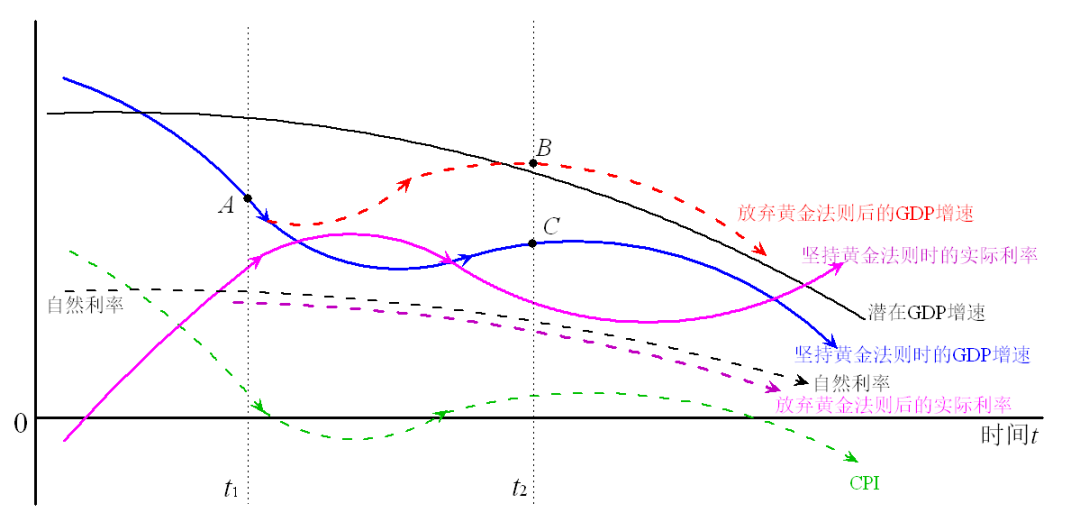
However, the central bank did not do so and instead stubbornly maintained nominal interest rates, leading to persistently high real interest rates. This approach, akin to cutting the mark to fit the boat, amplifies economic fluctuations. I illustrated this issue with Figure 8 at the time. In Figure 8, the potential GDP growth rate (i.e., the natural output growth rate, solid black line) and the natural interest rate (dotted black line) show a long-term decline, consistent with China’s situation at the time.
At time t1, the economy is at point A, with GDP below the potential GDP growth rate, indicating a negative output gap and low prices (green dotted line). This also aligns with China’s situation since 2022.
If the central bank adheres to the Golden Rule and does not reduce nominal interest rates (not shown) or only slightly reduces them, the real interest rate (pink solid line) will continue to rise, burdening economic agents. As a result, GDP growth will continue to decline along the blue solid line. Due to the lack of policy support, economic self-adjustment will be very slow. Several quarters later, at time t2, the economy will be at point C, still with a negative output gap, low CPI, high real interest rates, and a very weak economy. Economic agents (enterprises, residents, and the government) will endure prolonged suffering, with continued deterioration of income statements and balance sheets. Enterprises and residents will have pessimistic expectations for the future, tending to shrink balance sheets, cut investments, and reduce spending, leading to continued economic weakness.
Conversely, if the central bank abandons the Golden Rule and decides to follow the Taylor Rule or refer to the natural interest rate, timely reducing nominal interest rates (not shown) to bring down real interest rates along the pink dotted line to be equal to or slightly lower than the natural interest rate, then the financing costs for economic agents will decrease, and their balance sheets will not further deteriorate. GDP growth will follow the red dotted line. Several quarters later, at time t2, the economy will be at point B, roughly consistent with the potential GDP growth rate. If real interest rates are consistently maintained equal to the natural interest rate (i.e., the central bank maintains a neutral monetary policy stance), then GDP growth can also remain consistent with the potential GDP growth rate.
In summary, during periods of economic weakness and low prices, if the central bank refuses to reduce nominal interest rates, residents and enterprises must endure the economic downturn, painfully enduring the entire economic cycle before slowly recovering. This process takes a long time, exacerbates economic fluctuations, and causes unnecessary suffering for economic agents (welfare loss), contrary to the central bank’s goal of maximizing welfare. The recovery process could also be interrupted by various factors (Figure 6).
Based on these analyses, I recommend that the central bank promptly and significantly lower the LPR, at least bringing real interest rates down to around 2%. Even if this does not stimulate consumption and investment, it can create a loose liquidity environment, allowing local governments, enterprises, and residents to borrow funds at very low interest rates, refinance their high-interest debts, improve their balance sheets, and slow down the speed and momentum of balance sheet recession.
On July 25, 2023, the governor of the central bank was replaced. Since then, the central bank’s “Monetary Policy Implementation Report” has no longer mentioned the “Golden Rule.” However, it wasn’t until February 20, 2024, that the LPR was adjusted downwards.
On April 30, 2024, the Politburo meeting proposed: “We should flexibly use policy tools such as interest rates and reserve requirement ratios to increase support for the real economy and reduce the comprehensive financing costs of society.” This implies that there will be continued reductions in reserve requirements and interest rates in the future. I believe this is a correction of the previous sluggish interest rate cuts. I think the LPR should be reduced by 50-70BP in the coming year. Additionally, we should accelerate deepening reforms and encourage innovation to delay the arrival of zero and negative interest rates.
(3) Inertia Thinking, Lagging Behind the Situation
Given the obvious drawbacks of the “Golden Rule,” why did the former central bank governor persist with this rule? I believe this is due to inertia thinking.
The performance of an economy in the “golden age” is completely different from when it is in the “catch-up phase.” In the “golden age,” residents’ incomes grow rapidly, the middle class expands quickly, everyone shares the dividends of economic development, and is full of hope and confidence for the future, with strong investment and consumption growth, a high money multiplier, and a tendency for inflation. However, in the “catch-up phase,” most people’s income growth slows down, consumption capacity decreases, the money multiplier decreases, and inflation is much less of a problem.
However, people (including economists, central bank governors, and government policymakers) often do not realize that the economy has entered the “catch-up phase” and still cling to the inertia of the “golden age,” easily extrapolating the trends of “golden age” economic indicators. Koo (2023, p.159-160) believes that although all developed economies are currently in the catch-up phase, neither economics textbooks nor policymakers in these countries can escape the inertia of the “golden age.”
Specifically, Phelps’ (1961) “Golden Rule” was proposed in the 1960s when the United States was in the “golden age” after crossing the Lewis turning point. Workers’ wages were rising continuously, investment and consumption were growing vigorously, technological progress was rapid, and investment returns were high. Therefore, Phelps’ research question was, “What kind of savings (capital accumulation) path can maximize the welfare of residents?” It was strongly influenced by the times and did not foresee the large-scale balance sheet recessions that would occur years later, leading to excess savings and insufficient investment.
In China, since the reform and opening-up in 1978 until 2022, there has never been a real balance sheet recession. From the 1990s to 2010, local officials were constantly participating in the GDP race, showing investment hunger. After crossing the Lewis turning point in 2012, although investment and GDP growth rates fell somewhat, they were still relatively high, and residents’ income and consumption maintained high growth rates. During this period, although there were issues of insufficient total demand (1998-2001, 2008, 2018), they were quickly smoothed out by reforms or expansion policies. Residents and enterprises were full of confidence in the future, even after the outbreak of the pandemic in 2020.
In this context, the former central bank governor naturally maintained an optimistic outlook on the future, believing that GDP would trend towards high growth rates, and that the policy considerations should be on how to maximize residents’ welfare. He did not anticipate the sudden sharp decline in investment returns after 2022, the disappearance of borrowers, and the balance sheet recession, rendering past policies unsuitable for the new economic situation.
In fact, during the economic downturn in the second half of 2022, from policymakers to market researchers, almost everyone believed that the drop in total demand was temporary, caused by the pandemic restrictions limiting consumption scenarios and affecting production activities. As soon as pandemic controls were lifted, residents would engage in “revenge consumption,” enterprises would go full throttle in production, and economic growth would quickly return to pre-pandemic levels. It wasn’t until after April 2023 that people realized residents and enterprises were still deleveraging, and the recovery in consumption and investment was very weak and would take a long process.
This inertia thinking also affected the understanding of real interest rates. In the “golden age,” due to strong demand, inflation was likely. Especially from 2010 to 2021, China’s housing prices grew rapidly. Naturally, the central bank tended to maintain high nominal interest rates to keep real interest rates high, which could control inflation and housing prices. However, after the economy entered the “catch-up phase,” inflation was no longer a major issue, and there was a tendency for deflation. Coupled with a balance sheet recession, rigid nominal interest rates could easily lead to soaring real interest rates, harming the economy.
(4) Encouraging Home Buying When the Assets and Liabilities of Residents and Local Governments Should Be Improved, Leading to Further Deterioration of Their Balance Sheets
Since 2021, real estate inventories have accumulated, prices have dropped significantly, and many residents have defaulted or abandoned their properties. Real estate companies couldn’t recoup funds, and banks faced financial risks by not being able to recover loans.
On May 17, the central bank announced a policy to stimulate real estate: removing the lower limit on loan interest rates for purchasing commercial housing; reducing personal housing provident fund loan interest rates by 0.25 percentage points; lowering the minimum down payment ratio for first-time homebuyers from 20% to 15%, and for second-time homebuyers from 30% to 20%; establishing a 300 billion re-lending fund for affordable housing to support local state-owned enterprises in acquiring unsold commercial housing at reasonable prices for use as affordable rental or sale housing, expected to drive bank loans of 500 billion. The re-lending term for affordable housing is one year, extendable four times, with an interest rate of 1.75%. The NDRC required that in cities with high commercial housing inventories, the government could procure and purchase some commercial housing as affordable housing at reasonable prices.
To this point, the real estate stimulus policy has been the most lenient in history.
In the context of deteriorating balance sheets of local governments and residents, instead of helping them improve their balance sheets, such a real estate stimulus policy was introduced. Essentially, it aimed to let already heavily indebted residents and local governments continue to leverage, increasing their liabilities to take over the leverage of real estate developers and banks, reducing the default risk of developers and banks. In other words, policymakers chose “helping real estate developers and banks” over “improving the balance sheets of residents and local governments.” I guess this is because the former is more immediate, while the latter is more distant. The inconsistency in policy timing is evident.
In the long term, this will lead to further deterioration of the balance sheets of residents and local governments, further shrinking residents’ consumption capacity; local governments’ burdens will increase, making them less capable of infrastructure investment and public livelihood construction. Ultimately, this will bring hidden dangers of insufficient demand to the future economy, leading to a more severe balance sheet recession. It could even be said that the better the real estate stimulus effect, the greater the transaction volume, the more serious the future economic drag.
5. Fiscal Policy Not Only Failed to Expand Strongly and Timely but Also Artificially Created Contraction
(1) The Central Government Hesitated and Was Timid When It Should Have Quickly and Significantly Increased Leverage
Since 2022, the Chinese economy has fallen into a “balance sheet recession” and a “besieged phase.” Residents voluntarily reduce consumption, enterprises voluntarily reduce investment, pursuing debt minimization; local governments, due to heavy debt burdens, are unable to expand their balance sheets. In this case, the central government should expand its balance sheet, drive the economy, and mitigate the economic downturn.
Using Koo’s (2023) paradigm, since enterprises and residents are no longer willing to borrow, the government should act as the borrower of last resort to ensure the continuation of the credit creation process and create demand.
In principle, during a “balance sheet recession” and a “besieged phase,” fiscal policy is far more effective than monetary policy.
Therefore, in the second quarter of 2023, when it was found that the economic recovery was weak and residents and enterprises were still deleveraging, the central government should have quickly expanded its balance sheet, proactively expanded the fiscal deficit, and proactively increased leverage. For example, it could:
【1】Drive investment through major construction projects; establish various large industrial funds to invest in high-end technology projects, “bottleneck” projects, and attract private capital for joint investment.
【2】Substantially reduce taxes for enterprises, directly improving their balance sheets, nurturing them.
【3】Distribute cash to specific households, directly improving household balance sheets and stimulating consumption.
These measures need to be implemented quickly and with great intensity to promptly reverse the pessimistic expectations of economic entities and break the transmission mechanism of the balance sheet recession.
However, starting in 2023, the central government seemed unclear about the economic difficulties, hesitating and being timid:
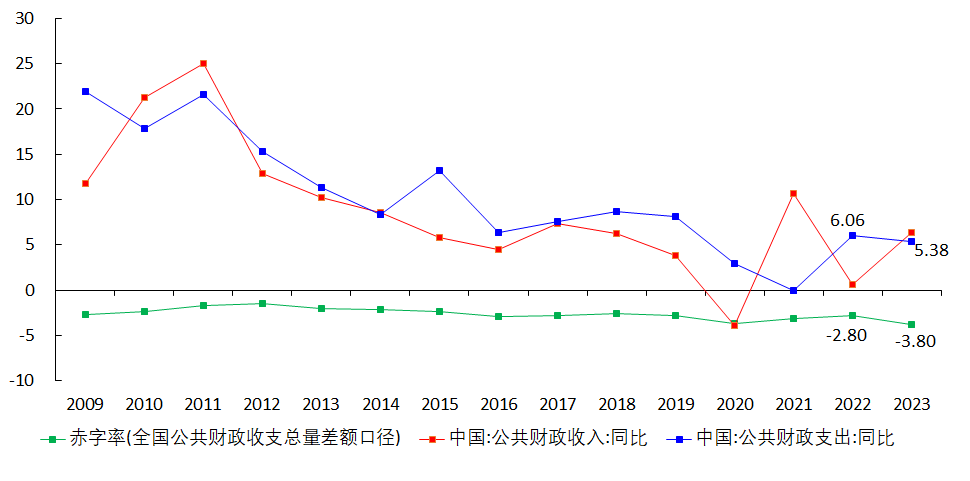
【1】The expansion of fiscal expenditure was not vigorous enough. In the first half of 2023, various sectors continuously called for the issuance of special treasury bonds to save the economy, but there was no movement. It wasn’t until October 25, 2023 (the day after the new finance minister took office) that it was announced that 1 trillion yuan of special treasury bonds would be issued. The growth rate of fiscal expenditure for the entire year of 2023 was only 5.38%, lower than that of 2022. The fiscal deficit increased by only 1 percentage point compared to 2022.
【2】Unwilling to directly give cash to specific households, seemingly worried that this would violate the socialist values of “more pay for more work, no pay for no work.” This reflects the rigid and inflexible thinking of the policymakers.
As a result, only some cities (Shanghai, Shenzhen, Beijing, Hangzhou, etc.) issued consumption vouchers to residents, but the effect was poor. The reasons are: ① The amount was too small, only 2-3 yuan per person on average, which could not stimulate consumption; ② Local governments issued consumption vouchers, but the beneficiaries might not be local enterprises, hence local governments lacked motivation. Actually, this matter is best handled by the central finance.
【3】Outdated concepts, clinging to old ways, thinking that giving consumers a little tax relief (such as reducing vehicle purchase tax) or giving enterprises some subsidies would stimulate them to buy durable consumer goods or upgrade machinery and equipment. Completely failing to understand that during a balance sheet recession, residents and enterprises are simply unwilling to consume and invest, making such measures have very limited effect.
On October 24, 2023, the new Minister of Finance took office. The next day, the Ministry of Finance announced that it would issue an additional 1 trillion yuan of special government bonds in the fourth quarter of 2023, increasing the national fiscal deficit for 2023 from 3.88 trillion yuan to 4.88 trillion yuan, the central fiscal deficit from 3.16 trillion yuan to 4.16 trillion yuan, and the fiscal deficit ratio from 3% to about 3.8%.
The Government Work Report on March 5, 2024, proposed issuing ultra-long-term special government bonds for several consecutive years starting from 2024, specifically for implementing major national strategies and building key area security capabilities, with 1 trillion yuan to be issued this year.
However, I believe this is still far from enough.
(2) When the National Tax Departments Should Have Supported Economic Activities, They Preemptively Collected Excessive Taxes and Back-Taxed, Draining the Pond to Catch Fish
In the current situation where enterprises and residents are universally contracting their balance sheets, tax reductions should have been implemented to improve the balance sheets of enterprises and residents, thereby stimulating consumption and investment. However, the tax departments have done the opposite by taking two measures:
First, they conducted back-taxes, collecting historical tax arrears.
While collecting historical tax arrears is legal, the timing is inappropriate. On a smaller scale, this measure can deplete enterprise cash flows, causing operational difficulties, forced shutdowns, or layoffs, leading to a decline in business revenue and operating profits, further entrenching the crisis. On a larger scale, it can deteriorate the business environment, causing unemployment, reduced consumer spending, and increased deflationary pressure.
Second, they pre-collected “excessive taxes,” i.e., future taxes.
Pre-collecting excessive taxes is harmful to the economy. Even if the economy starts on a steady growth path, pre-collecting excessive taxes can deviate it from this path. Over time, the GDP size will increasingly diverge from the steady growth path’s GDP size; the payable taxes will increasingly diverge from the steady growth path’s payable taxes.
During a period of rapid economic development, the negative impact of pre-collecting excessive taxes can be easily offset by subsequent economic growth, hence the negative effect on the economy is not as significant.
However, now that China’s economy has entered a “stage of internal and external challenges,” with GDP growth rates declining long-term and facing long-term deflationary pressures, the trend of nominal GDP growth will also decline, leading to a year-on-year decline in fiscal revenue. Pre-collecting excessive taxes at this time will exacerbate the pressure on economic growth, adding insult to injury. This would necessitate the continuous pre-collection of excessive taxes annually, or the fiscal system would become unsustainable. Persistently pre-collecting excessive taxes will cause enterprises and residents to further contract their balance sheets, compounding the decline in economic growth, and eventually leading to fiscal collapse.
These policies are contractionary, reflecting the tax departments’ lack of a big-picture perspective, draining the pond to catch fish, and drinking poison to quench thirst.
(3) When Local Governments Should Have Rested and Recuperated, They Killed the Goose that Laid the Golden Eggs
Local government expenditures generally exhibit severe rigidity. Since 2022, with the economic downturn and declining fiscal revenues, local governments have generally adopted the following measures to increase revenue:
First, they cut subsidies for public utilities (water, electricity, gas, and public transportation), pushing for price increases in public utilities.
This results in residents:
- Reducing consumption;
- Anticipating further increases in public utility costs, thereby increasing savings in advance, leading to a greater decline in consumption;
- Already being pessimistic about economic and income prospects. When the government cuts subsidies, residents perceive this as a signal of further economic deterioration, increasing savings to guard against future economic downturns and potential unemployment, thereby leading to a greater decline in consumption.
As a result, the reduction in consumption far exceeds the savings from subsidies, possibly reaching several times the amount saved. Even if the government spends the saved subsidy amount through other channels (such as government consumption or investment), the net effect on the economy is contractionary.
The rise in public utility prices itself will push up the CPI and PPI. Some foolish macro analysts might celebrate this, thinking it helps the economy out of deflation, but they overlook that it suppresses consumption, depresses the CPI and PPI, ultimately leading to more severe deflation.
If every local government raises public utility prices, it would be disastrous for the entire economy, essentially “digging a hole for the people,” worsening residents’ balance sheets, and lowering their willingness and ability to consume. In the long term, this will lead to local consumption stagnation, sluggish economic growth, and the government’s balance sheets also failing to recover.
Second, they increased the intensity of administrative penalties to raise revenue from fines and confiscations.
In some cities, revenue from fines and confiscations accounts for over 40% of local fiscal revenue. Its economic impact is similar to raising public utility prices but even more severe because it not only forces residents and enterprises to further contract their balance sheets but also seriously undermines the local business environment.
The central government is currently planning to reform the consumption tax, changing it from entirely central to central-local shared revenue, giving local governments an additional income source. The problem is that, judging from the national tax’s pre-collection of excessive taxes and back-taxing, and local governments’ increased fine revenue, both the national tax and local governments lack foresight and a big-picture perspective. In this context, simply implementing central-local revenue sharing cannot solve their short-sighted, exploitative practices.
It should be noted that increasing taxes during an economic downturn is a foolish act that even the Japanese government has committed. When Japan’s bubble burst in 1990 and entered the “chased phase” in 1995, the IMF and OECD pressured the Japanese government to reduce the fiscal deficit. As a result, the Japanese government implemented a fiscal tightening plan (tax increases, spending cuts) equivalent to 15 trillion yen (3% of Japan’s GDP) in April 1997, leading to a further economic downturn with GDP declining for five consecutive quarters. Some banks that survived the previous seven-year recession began to fail. The Japanese government made similar mistakes again in 2001 and 2009.
The Chinese government should learn from Japan’s mistakes rather than repeat them.
VI. What Are the Characteristics of China’s Economy in the “Back-to-the-Wall Stage”?
In the “back-to-the-wall stage,” the economy will exhibit the following characteristics:
1. Long-term Decline in Potential GDP Growth Rate
Currently, China’s potential GDP growth rate is about 5%. In the future, as the natural interest rate declines, the potential GDP growth rate will also decrease year by year. The actual year-on-year GDP will follow this trend, possibly dropping to 1-2% in 20 years.
It is worth noting that if the country is viewed as a company, GDP is equivalent to revenue, not profit. This company has particularly low efficiency; in 2023, the year-on-year GDP was 5.2%, corresponding to a year-on-year profit of above-scale industrial enterprises of only -2.3%, and the stock market is in a bear market. If TFP cannot be improved quickly, when China’s GDP growth rate decreases to only 1-2% in the future, the growth rate of corporate profits will be predictable.
2. M1, M2, Social Financing Scale, and Loan Balance Stock Year-on-Year Growth Rates are at Low Levels
In April 2024, the year-on-year growth rates of M1, M2, social financing, and loan balance all hit historical lows, causing widespread discussion. In my opinion, this is an inevitable phenomenon in an economy trapped in the “back-to-the-wall stage.”
During the “golden age,” economic growth was strong, household income increased, and even people with low education and lacking skills could easily find jobs. People were very optimistic about the future, with high marginal propensity to invest and consume. Investment and consumption growth rates were relatively strong, and there was a strong demand for loans, easily pushing up the money multiplier. Monetary policy was very effective, easily leading to inflation. Therefore, the year-on-year growth rates of M1, M2, social financing, and loan balance were undoubtedly high.
However, as the economy enters the “catch-up stage,” domestic factor costs rise, and investment returns decline. Due to the lack of profitable investment opportunities, corporate financing willingness and investment propensity decrease, the savings rate increases, leading to a decline in consumption growth, rising unemployment, a decrease in household income growth, and even negative growth, with a widening gap between the rich and poor. Due to the lack of economic vitality, the year-on-year growth rate of M1 will be at a low level.
The financing willingness of enterprises and households drops significantly, leading to a decrease in the money multiplier, a slowdown in money circulation speed, and a less smooth money creation mechanism, causing the year-on-year growth rates of M2 and loan balance to drop to lower levels.
The amount of funds loaned by the financial sector to the real sector declines, resulting in the year-on-year growth rate of the stock of social financing scale dropping to a low level.
On May 10, 2024, the central bank released the Q1 “Monetary Policy Implementation Report,” with Column 1 titled “The Relationship Between Credit Growth and High-Quality Economic Development” stating that with economic transformation and upgrading, the relationship between credit growth and economic growth in China has weakened. A decline in credit growth to single digits does not mean a weakening of financial support for the real economy. The main reasons are: [1] With economic structural adjustments and upgrading, the real estate sector is declining, local debt risk control is strengthening, and the proportion of heavy and chemical industries is decreasing, leading to reduced credit demand. [2] With the growth of credit stock, the marginal effect of credit issuance diminishes. Excessive credit issuance can lead to idle funds. [3] The proportion of direct financing is increasing.
These points are reasonable. In the long run, these three factors will continue to exist, causing monetary supply indicators to remain at low levels. In the future, very low M1, 7% or even lower M2, 8% or even lower social financing year-on-year growth, and 9% or even lower loan balance year-on-year growth will become the norm.
3. Particularly Prone to “Balance Sheet Recession”
A “balance sheet recession” may occur before or after the economy enters the “back-to-the-wall stage.” However, in the “back-to-the-wall stage,” it is particularly prone to “balance sheet recession” and it may happen repeatedly.
This is because the essence of the “back-to-the-wall stage” is that real factors lead to a decline in the marginal return on investment in the domestic real sector. When it drops to a certain level (point H in Figure 3), lower than that of latecomer countries, domestic enterprises have to invest abroad to profit, utilizing lower factor costs in foreign countries to earn higher investment returns. This leads to a comprehensive decline in domestic consumption, investment, employment, and economic growth. When it is generally unprofitable for enterprises to invest domestically, they will actively shrink their balance sheets, cut investments, leading to more unemployment; residents will actively shrink their balance sheets, cut consumption, resulting in a balance sheet recession.
4. Long-term Deflationary Pressure, Hard to Reverse
In the “back-to-the-wall stage,” due to the lack of profitable investment opportunities domestically, corporate financing willingness and investment propensity decline, the savings rate increases, leading to a decline in consumption growth, rising unemployment, a decrease in household income growth, and even negative growth. Obviously, at this time, the economy is prone to deflation.
Since 2022, China has been under significant deflationary pressure. If the deflationary pressure comes from a short-term decline in demand (like in 2008), then as demand quickly recovers, the deflationary pressure will disappear. However, the deflationary pressure since 2022 stems from real factor changes leading to a decline in the natural interest rate, which is a long-term trend and hard to reverse. Therefore, the total demand contraction and increased deflationary pressure it brings are also hard to reverse and will exist for a long time. Untimely policies from local governments and tax departments have further exacerbated the deflationary pressure.
Moreover, China’s manufacturing capacity currently accounts for about 30% of the world’s total, with approximately 15% supplying foreign markets (exports) and 15% supplying the domestic market. When external demand weakens, if domestic demand can strengthen to absorb the excess supply, it can alleviate deflationary pressure. The problem is that after China enters the “back-to-the-wall stage,” on one hand, domestic consumption and investment demand growth rates decline; on the other hand, exports will face blockades from Europe, the US, and Japan (increased tariffs, import restrictions), and competition from Southeast Asia, South Asia, Mexico, etc. Thus, both internal and external demands are squeezed, easily causing overcapacity and increasing deflationary pressure.
5. Unable to Use Administrative Measures to Reduce Overcapacity Again
So, is it possible to use administrative measures to reduce overcapacity again, like in 2016-2017, forcing small and medium-sized enterprises that fail to meet environmental standards to exit the industry, artificially causing a reduction in supply-side capacity, raising product prices, thereby helping the economy escape deflation and improving the cash flow and profit statements of surviving enterprises?
I believe it won’t happen, and it shouldn’t. The reasons are:
First, the current economic environment is completely different from that of 2016-2017.
In 2016-2017, the economic growth rate and corporate profit growth rate were still relatively high. At that time, forcing some enterprises out of the market to improve the situation of the remaining enterprises had little impact on the overall economy. Now, however, the overall economic situation is very poor, with declining GDP growth and corporate profit growth. In this context, forcing a batch of enterprises to exit will cause severe unemployment.
Second, the current overcapacity is different from the overcapacity of 2012-2015.
The overcapacity of 2012-2015 was caused by the investment-led development model of the previous decade, mainly concentrated in traditional cyclical industries (steel, coal, non-ferrous metals, chemicals, building materials, etc.). Much of this capacity was indeed relatively backward and could not meet market demands, and should have been eliminated. After the supply-side reform of 2016-2018, capacity was upgraded or newly built. The current “overcapacity” since 2022 is caused by the rapid decline in GDP growth and insufficient demand, rather than outdated capacity that cannot meet market needs. Reducing capacity would shift the total supply curve to the left, causing further declines in GDP growth, making it even harder for small and medium-sized enterprises with weak competitiveness and poor risk resistance. Small and medium-sized enterprises are the main absorbers of employment, and if they fail in large numbers, it will inevitably threaten social stability.
Third, administrative measures to reduce capacity usually eliminate private enterprises, further causing the state to advance while the private sector retreats, reducing TFP, and leading to even lower marginal returns on investment.
Fourth, frequent use of administrative measures to reduce capacity will lead to the hollowing out of manufacturing.
In the “back-to-the-wall stage,” weak investment and consumption will persist for a long time. If administrative measures are used to reduce capacity whenever there is “relative overcapacity” and deflationary pressure, in the long run, continuous capacity reduction will ultimately aggravate the hollowing out of manufacturing. Under the current situation where the US is leading the decoupling from the Chinese economy and trying to break away from the Chinese supply chain, the hollowing out of manufacturing is tantamount to self-destruction.
(VI) It Is Inappropriate to Use Inventory Cycles to Analyze the Economy and Expect a New Cycle to Start
In September 2023, the National Bureau of Statistics released industrial enterprise economic benefit indicators, showing a slight rebound in the nominal year-on-year inventory of finished goods. Many macro analysts at financial institutions were overjoyed, believing that a new inventory cycle was about to start, and the upward phase would last for 3-4 quarters, leading to a significant stock market increase.
This view is obviously incorrect. At the time, I wrote several articles to refute this perspective, arguing that the industrial destocking process was not over and that inventory replenishment was far off (click 1, 2). Facts have proven my analysis correct.
Furthermore, since 2012, I have opposed applying an idealized inventory cycle model to China’s economic reality, assuming the four stages of the cycle would follow sequentially like the seasons and that each stage would last 3-4 quarters systematically.
In fact, during the period of overcapacity and declining demand growth from 2012 to 2015, the government’s policies to stabilize growth distorted the inventory cycle, prolonging the destocking process. Each stage of the inventory cycle became very short and smaller in magnitude. If overcapacity is not timely resolved, it will continue to suppress corporate profit margins and profit growth, causing them to fluctuate at low levels. This is the logical basis for the supply-side reform and capacity reduction initiated in 2016.
As China’s economy currently faces the “stage of being besieged from both sides,” the growth rate of demand will weaken year by year. Even if there is a rebound in total demand, it will be very weak, resulting in a very weak inventory cycle. Additionally, simply reducing capacity can no longer save the PPI. In this situation, trying to analyze the inventory cycle, judge the industry’s operations based on it, and use the Merrill Lynch clock for asset allocation will inevitably be ineffective.
(VII) Capital Idleness Will Become the Norm
Since 2022, capital idleness has re-emerged in China, attracting the attention of regulatory authorities.
On the morning of August 4, 2023, the National Development and Reform Commission, Ministry of Finance, People’s Bank of China, and State Administration of Taxation jointly held a press conference. Zou Lan, director of the Monetary Policy Department of the People’s Bank of China, said in response to a reporter’s question: “(We should) both adjust counter-cyclically according to the economic and financial situation and macro-control needs in a timely and appropriate manner, and balance growth and risk, internal and external balance, prevent capital arbitrage and idleness, improve policy transmission efficiency, and enhance the prudence of bank operations.”
On November 22, 2023, the National People’s Congress website released “Opinions and Suggestions on the Financial Work Report,” which mentioned: “Recently, China’s M2 growth is high, and M1 growth is low, which is unmatched. One reason is the idleness of monetary funds between banks or between banks and large enterprises, making it difficult for credit funds to reach small and medium-sized enterprises.”
The “Government Work Report” on March 5, 2024, pointed out: “Strengthen both total and structural regulation, activate stock, improve efficiency, and increase support for major strategies, key areas, and weak links. Promote the stabilization and reduction of comprehensive financing costs for society. Smooth the transmission mechanism of monetary policy to avoid the idleness of funds.”
These all indicate that the central government is trying to prevent capital idleness.
The problem is that the root cause of this round of capital idleness is the decline in the natural interest rate (rate of return on investment), which has led to an “asset shortage.” Real enterprises are unwilling to invest, residents are unwilling to consume, and a large amount of capital has nowhere to invest, thus flowing into financial institutions and being leveraged to invest in long-term bonds. As the natural interest rate continues to decline in the future, this situation will persist.
The central bank has only two ways to stop capital idleness:
- Tighten monetary policy and withdraw liquidity. This will obviously cause economic growth to slow down, which the central bank is unwilling to do.
- Maximize structural monetary policies and strictly control the flow of funds out of the banking system. This approach is extremely costly.
Therefore, neither of these points can be adopted.
In short, in the “stage of being besieged from both sides,” the central bank must maintain a loose liquidity situation, which inevitably means that a portion of funds will be idle and cannot be completely eliminated. This is one of the reasons I have always been optimistic about long-term bonds.
(VIII) Fiscal Deficit Will Gradually Rise, Requiring the Government to Open Up Its Mind and Dare to Increase the Deficit Rate
After the economy enters the “stage of being attacked from both sides,” the effectiveness of monetary policy gradually declines, and fiscal policy becomes more effective. This means that fiscal policy will become the main force for stabilizing the economy, while monetary policy only needs to maintain a loose stance and cooperate well.
Fiscal expansion means an increase in the fiscal deficit. This requires the government to completely change its mindset, open up its thinking, and dare to increase the fiscal deficit rate.
Taking Japan as an example. After Japan fell into recession in 1990, the Japanese government began to expand the fiscal deficit to stabilize the economy. However:
“Orthodox fiscal hawks dominated the Japanese media and academia, trying to set obstacles for fiscal stimulus, stating that a large fiscal deficit would soon lead to soaring interest rates and a fiscal crisis. Once there were signs of economic recovery, the hawks would pressure politicians to cut stimulus measures, thereby triggering a new round of economic recession. The resulting intermittent fiscal stimulus did not increase the public’s confidence in the government’s handling of the economy…” (Gu Chaoming, 2023, p.069). It was not until 1997 that the IMF and OECD pressured Japan to cut its fiscal deficit, which worsened Japan’s recession.
This is why I said earlier that issuing 1 trillion special treasury bonds each year is far from enough. The fiscal policy should be: as long as the economy does not improve, continue to expand the fiscal deficit. Instead of setting strict deficit rate limits in advance, tying your own hands and feet, and not daring to break through.
(IX) In the Long Run, Treasury Yields Will Continue to Decline to Zero or Negative Values
The decline in the natural interest rate leads to a “shortage of assets” in the entire society, the ROE of listed companies decreases, and the stock market lacks systematic investment opportunities. Financial institutions invest a large amount of funds in the bond market, leading to a continuous decline in long-term treasury yields since the second half of 2023.
In the long run, if institutional reforms cannot release institutional dividends, and if the new round of technological revolution cannot be seized to improve the investment return rate of various industries, then with the aggravation of population aging, the natural interest rate will continue to decline. Eventually, like the United States and Japan, the natural interest rate will drop to around zero or even negative values, and the growth rate of natural output (potential GDP) will also drop to a very low level. The actual GDP growth rate will decline year by year, falling to 1-2% after a decade or so.
Therefore, in the long run, treasury yields will also drop to zero or even negative values. Therefore, since the second half of 2023, I have always been optimistic about interest rate cuts and long-term bond investment opportunities, believing that as long as there is an adjustment, it is a buying opportunity.
In the summer of 2021, I still thought that China’s natural interest rate dropping to zero would be a matter of 20-30 years later. Looking at it now, this day is getting closer and closer to us.
The central bank is very vigilant about the decline in ultra-long-term yields. On April 23, 2024, a responsible person from the relevant department of the central bank said in an interview with a reporter from the Financial Times:
“Theoretically, fixed-rate long-term bonds have long durations and are sensitive to interest rate fluctuations. Investors need to pay close attention to interest rate risks. For trading investors, by increasing leverage and extending duration, they can obtain more returns in the short-term price surge, but it also easily exacerbates market volatility and bears the risk of substantial price declines. For allocation investors such as banks and insurance companies, if a large amount of funds is locked in low-yield long-duration bond assets, they will face a passive situation where income does not cover expenditures if the cost of liabilities rises significantly.”
It also reminded investors to control risks by using the collapse of Silicon Valley Bank in the United States in March 2023 as an example.
On July 1, 2024, the central bank entered the market, borrowing treasury bonds and selling them, causing a sharp drop in treasury prices. On July 2 and 3, 2024, bond prices rose, with 10-year treasuries fully recovering their losses and 30-year treasuries partially recovering. The central bank can take this opportunity to train its ability to manipulate the yield curve but cannot reverse the long-term downward trend.
(X) The Central Bank Will Be Forced to Enter the Market to Trade Treasuries, Implementing Fiscal Deficit Monetization, and Adopting QE When Necessary
On April 23, 2024, a responsible person from the relevant department of the central bank also said in an interview with a reporter from the Financial Times:
“The central bank’s buying and selling of treasuries in the secondary market can be used as a liquidity management method and a monetary policy tool reserve… Some developed economies’ central banks were forced to buy large amounts of treasuries one-sidedly to achieve monetary policy goals when conventional monetary policy tools were exhausted, but our country insists on implementing normal monetary policy. The People’s Bank of China’s buying and selling of treasuries is fundamentally different from these central banks’ quantitative easing (QE) operations.”
Indeed, our current natural interest rate is positive, and the return on investment in the real economy is also positive, so we can still “insist on implementing normal monetary policy.” Therefore, the central bank’s buying and selling of treasuries are fundamentally different from the West’s QE. But in the long run, as the natural interest rate, natural output growth rate, and investment return rate continue to decline, sooner or later, one day, like the US, Europe, and Japan, the natural interest rate will approach zero or become negative. At that time, QE operations will have to be adopted frequently.
To delay this day, on the one hand, policymakers must do their utmost to deepen reforms, stimulate innovation, and improve the return on investment in the economy. On the other hand, the central bank should quickly enter the market to directly trade treasuries, so:
It can flexibly control the yield curve.
In the long run, it can cooperate with the fiscal department to finance the fiscal deficit. Although I personally hate deficit monetization, it is an unavoidable choice.
It accumulates experience for future QE operations.
(XI) The Gap Between the Rich and the Poor Will Widen, and the Gini Coefficient Will Rise
As mentioned earlier, theoretically, before the economy reaches the “Lewis Turning Point,” the gap between the rich and the poor will widen; after crossing the “Lewis Turning Point” and entering the “Golden Age,” the gap between the rich and the poor will narrow; after crossing the “Gu Chaoming Turning Point” and entering the “stage of being attacked from both sides,” the gap between the rich and the poor will widen again. This has been verified in the United States, France, Germany, India, Thailand, and other countries.
From China’s data, from the 1990s to the 2010s, with the rapid growth of GDP, some people got rich first, the gap between the rich and the poor widened, and the Gini coefficient quickly rose above 40. Around 2010, the Gini coefficient peaked. Since then, with the upgrading of the industrial structure and the transfer from the east to the central and western regions, the “first rich” began to drive the “later rich,” and residents’ incomes generally grew rapidly, sharing the dividends of economic growth, and the Gini coefficient began to decline.
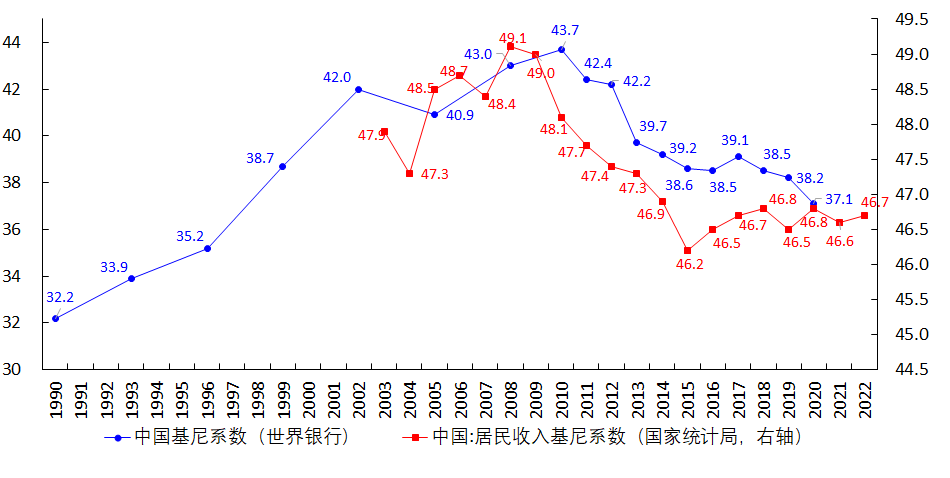
As the economy enters the “stage of being attacked from both sides,” economic growth slows down, total demand growth slows down, residents’ income growth declines, and even negative growth. Only those with advanced technology or strong learning ability and adaptability can find jobs. Those whose jobs can easily be transferred abroad will easily become unemployed and fall into poverty. The gap between the rich and the poor will widen, and the Gini coefficient will rise. This will obviously cause social instability.
(XII) Engel’s Coefficient Will Rise, and Residents Will Spend a Larger Proportion of Their Income on Food
Engel’s Law states that the lower a family’s income, the larger the proportion of income spent on food, and the lower the proportion spent on education, cultural entertainment, and medical and health care.
Since 1978, China’s Engel’s coefficient has been trending downward, which is typical of an economy in the process of urbanization/industrialization.
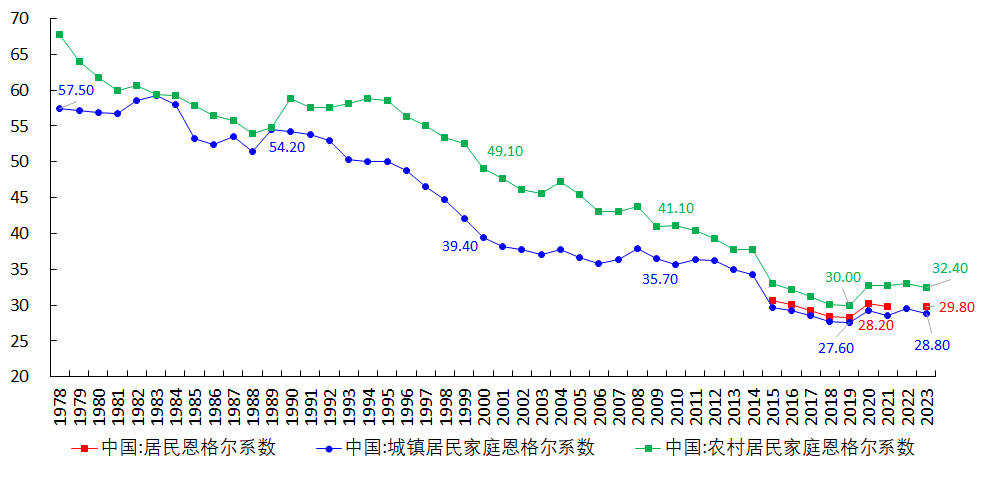
However, I have noticed that since 2020:
Chinese residents’ consumption expenditure growth has been declining due to: [1] the pandemic leading to a lack of consumption scenarios; [2] households actively shrinking their balance sheets and cutting consumption expenditures.
Food expenditure is rigid.
This has led to a significant rebound in Engel’s coefficient from 2020 to 2023.
As the economy enters a “besieged phase,” the growth rate of total demand is declining, and the growth rate of household income is decreasing, even experiencing negative growth. Those jobs that can easily be outsourced abroad will face a higher risk of unemployment, leading to a difficult life. Logically speaking:
- Residents will cut down on consumption expenditures, prioritizing spending on essential living needs (such as food, housing, utilities, healthcare, etc.), and reducing spending on luxury and discretionary goods (such as clothing, cultural entertainment services, etc.). This will lead to an increase in the Engel coefficient.
- As the growth rate of income further declines, during severe economic recessions, residents will lower their demands even for necessities. For example, they will lower their food standards, no longer pursuing “eating well,” and reduce the purchase of “high-end food” and “discretionary food,” aiming merely to “eat enough,” purchasing only the food that meets basic living needs. This will result in a decrease in residents’ food expenditures. However, since both income and consumption expenditures are reduced at this time, the Engel coefficient should still increase.
- In extreme cases, as the economy worsens, residents’ savings will gradually be depleted, and they will start cutting down on essential living expenditures, further lowering the “quality” requirements for necessities while maintaining basic quantity needs. Even the “quantity” requirements might be reduced.
In summary, I believe that the downward trend in China’s Engel coefficient has ended, and it is unlikely to decrease further. With the long-term decline in economic growth, the Engel coefficient will rise.
Analysis of Japanese data reveals that, after 1996, the Engel coefficient in Tokyo oscillated and slowly increased (see chart here), aligning with my judgment of the Engel coefficient for “catch-up economies.” In terms of consumption structure, from 2002 to 2023, households in Tokyo:
Increased the share of expenditures on food, education, healthcare, and household goods in their total consumption expenditure.
Decreased the share of expenditures on cultural entertainment, housing, clothing, and footwear, as well as other aspects.
The share of expenditures on fuel, water, electricity, lighting, transportation, and communication remained roughly stable.
This change is largely similar to the change in the consumption structure of Chinese residents since 2020, where basic living needs are ensured while “discretionary goods” are cut down. Understanding this can help in avoiding unpromising industries when making sector allocations in the stock market. See details here.
(XIII) The Birth Rate Will Continue to Stay Low
The birth rate depends on the residents’ wealth stock, expected income levels, childcare costs, and other factors. In recent years, the pandemic, declining income growth, and rising childcare costs have collectively led to a decrease in the birth rate.
In the “beleaguered stage,” income growth will further decline, and living pressures will increase, inevitably leading to a further decline in the willingness to have children, keeping the birth rate at a low level. Since the mortality rate is relatively stable, the final result will be a yearly decline in the total population.
Relying on subsidies, extended maternity leave, and other methods cannot reverse the declining birth rate trend because the utility brought by subsidies and leave is limited and far from enough to offset the pain caused by declining income growth and childcare costs.
Incidentally, more frightening than the decline in the total population is the deterioration of the population structure. Nationally, especially in some provinces in the northwest and southwest, the proportion of the Han population is continuously decreasing, and the decline in the proportion of Han children and newborns is alarming. This will inevitably pose a severe threat to national stability in the future.
(XIV) Populism and Extreme Nationalism Will Resurface and Collude
Former Vice Premier Liu He (2013) summarized the social trends following the outbreak of foreign financial crises, saying:
“After a crisis breaks out, policymakers always face three major challenges: populism, nationalism, and the politicization of economic problems. Market forces constantly challenge unconvincing government policies, making the crisis situation worse.” (Liu He, 2013, p.11)
I think this analysis is also quite fitting for predicting China’s future.
In China, both nationalism and populism have a broad social foundation. Since 1978, China’s rapid economic development has masked many social contradictions. As the economy enters the “beleaguered stage,” those lacking learning abilities will be unable to adapt to industrial changes and the impact of the times, falling into unemployment, with declining income levels, and living in hardship. Their cognitive abilities are limited, and they are confused and bewildered by the impact of the times, unable to understand why they find themselves in such a plight.
At this time, some self-media will start to promote populism and irrational extreme nationalism, spreading rumors and advocating various fallacies. For example, they will claim that economic problems and the plight of ordinary people’s lives are due to the government’s disregard for the interests of the lower classes, the monopoly of power by the privileged, the unfair distribution system, the impact of technological progress (such as e-commerce affecting physical stores), the deliberate plunder by the elite class, capitalist conspiracies, foreign infiltration, and globalization taking away their job opportunities, among others.
People who lack learning and cognitive abilities also lack discernment, making them more easily deceived by these fallacies, becoming faithful followers of populism and irrational nationalism. The collusion of populism and extreme nationalism will destabilize society.
“When the space for public policy is squeezed very small, the populist policies adopted by the governments of developed countries are usually the driving force behind crises. The psychological pressure caused by technological changes and the widening distribution gap often leads to public dissatisfaction. Unable to change the status quo during their tenure and driven by electoral politics, governments tend to adopt more populist policy declarations to appease the public.” (Liu He, 2013, p.10). Our government should also avoid adopting populist policies and avoid using policies to please and pander to populists.
(XV) Suicides, Fraud, and Other Crimes Will Increase
After the economy enters the “catch-up stage” or “beleaguered stage,” due to declining income growth and rising unemployment, the suicide rate will rapidly increase, as proven by data from Japan, South Korea, and the United States (click to view data).
I also noticed that the rise in the suicide rate usually does not start at the beginning of economic deterioration but only a few years later.
I guess the reason is:
When the economy suddenly falls from the “golden age” into the “beleaguered stage,” most people do not believe the economy will remain sluggish. They hold on to the beautiful memories of the “golden age,” thinking the economy is only temporarily poor. They believe they can rely on their savings and that if they endure for a few years, the economy will improve; or if they work harder and take on another job, they can offset the income decline.
However, the root of the “beleaguered stage” is the downward trend in investment returns caused by real factors. In the face of this historical trend, individual efforts are negligible. A few years after the economic deterioration, they will find that no matter how hard they try, they cannot change their situation. After a series of setbacks, they completely lose confidence, become utterly disheartened, and choose suicide. The suicide of one person will have a strong “demonstration effect,” encouraging those with the same thoughts but have not acted to follow suit.
As mentioned earlier, I judge that the Chinese economy fell into the “beleaguered stage” in 2022. From 2024 onwards, a noticeable increase in suicides has been observed. I predict:
【1】The suicide rate in China will continue to rise in the coming years;
【2】Similar to Japan and South Korea, male suicides in China will dominate, accounting for about 70%.
Additionally, as unemployment increases, residents will hope to gain compensation from lottery winnings, leading to an increase in lottery sales. Some residents will also go abroad to seek investment opportunities.
However, when residents cannot obtain income through legal channels, they will seek to gain income through illegal means, leading to an increase in various crimes:
【1】The number of sex workers will increase, and prices will drop;
【2】Fraud cases will increase because, compared to theft and robbery, fraud has low costs, low risks, and high returns;
【3】Theft and robbery cases will increase;
【4】In the context of widening wealth gaps, some people will attribute their personal difficulties to society, leading to a rise in heinous crimes such as random street attacks, vehicular assaults, school and kindergarten attacks, and revenge killings.
In short, the days will no longer be peaceful.
VII. Capital Market: Long-Term Lack of Systematic Opportunities in the Stock Market, Long-Term Optimism for the Bond Market
(1) TFP and Natural Interest Rates Suppress the Chinese Stock Market
Now, let’s extend the analytical framework of Figure 1 to the capital market.
Logic Chain 9: The growth rate of EPS of listed companies, market environment, and investor risk appetite together determine the valuation of listed companies.
Logic Chain 10: The growth rate of EPS and valuation of listed companies together determine stock prices.
Logic Chain 11: The stock prices of listed companies, along with factors such as the industry distribution of listed companies, investor structure, trading system, and regulatory system, determine the overall index. Ultimately, the industry distribution of listed companies depends on the economic structure.
Combining Logic Chains 1-8, real factors determine TFP, natural interest rates, and natural output, and by affecting the real economy, ultimately determine the EPS, ROE, and valuation of enterprises, and finally determine stock prices.
Analyzing data and stock markets in economies like Japan, South Korea, Taiwan, and the United States reveals that long-term bull markets in these economies’ history are all related to high TFP growth rates. When TFP growth rates decline, corresponding bear markets occur (see specific analysis here).
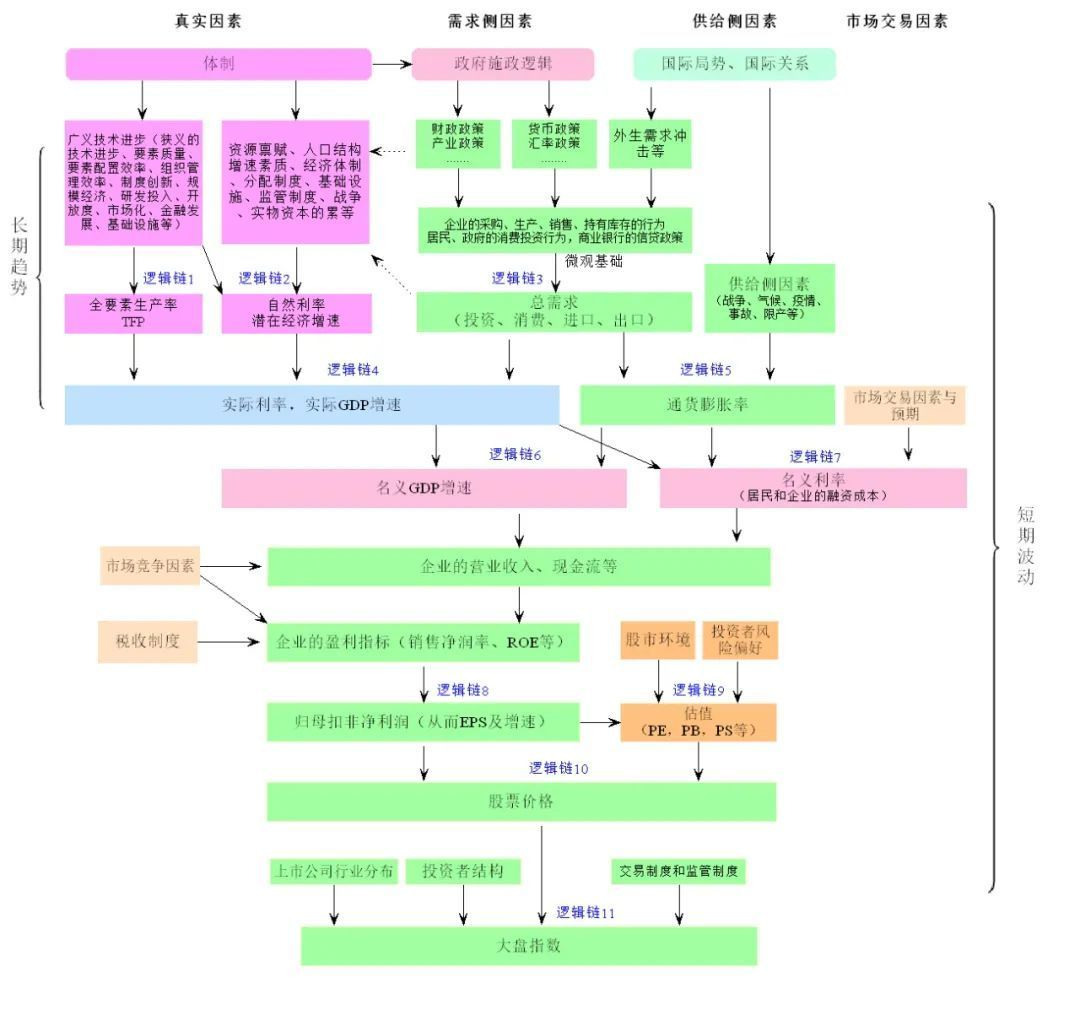
From 2001 to 2007, China’s TFP growth rate was relatively high, but it significantly declined after 2008.
Specifically, during the takeoff phase of the Chinese economy, in 1983-1987, 1991-1997, and 2001-2007, the TFP growth rate was far lower than the levels of economies like Canada, France, Germany, Spain, Italy, Taiwan, Japan, Israel, and Malaysia from 1955-1980. The reasons are:
- Imbalanced industry and regional development.
- SOEs and government intervention distorted resource allocation and reduced efficiency.
- Issues with the growth model, relying more on factor input than technological progress.
- Population aging.
After 2008, China’s TFP growth rate has continued to be low. The reasons are:
- Population aging.
- Dual financing structure of SOEs and private enterprises, zombie enterprises, government intervention, etc., distorted resource allocation.
- China’s economic scale is already very large, and general technological progress brings limited TFP growth rate to the entire economy. Only epoch-making technological progress that enhances the TFP growth rate of most industries in the economy can improve the TFP growth rate of the entire Chinese economy.
- Chinese enterprises are more accustomed to imitation rather than innovation.
Analyzing the performance of the A-share market since 1995, it is found that China’s TFP growth rate can explain the overall ups and downs of the Shanghai Composite Index and the entire A-share market to some extent. Low TFP growth rate limits the level of return on investment in the real sector, making it difficult for the Shanghai Composite Index to break away from 3000 points for a long time. Even if it rises briefly for some reason (such as the upward fluctuation of the inventory cycle from 2005-2007, or the large-scale monetary stimulus in late 2014 to the first half of 2015), it will eventually fall back to 3000 points. Such a stock market is inevitable under this economic structure.
The continuous decline of China’s natural interest rate also suppresses the ROE of listed companies. In Figure 12, from 2004-2019, the correlation coefficient between the ROE of Shanghai A-shares and the natural interest rate is 0.70, and the correlation coefficient between the ROE of all A-shares and the natural interest rate is as high as 0.75. As pointed out earlier, the pandemic lockdown in 2022 further lowered China’s natural interest rate and TFP, leading to a further decline in ROE, which is the root cause of the continuous bear market in the stock market since early 2022.
(2) Other Reasons
In addition to the suppression of ROE by declining TFP growth rate and natural interest rate, several other factors make it difficult for A-shares (including the Growth Enterprise Market) to sustain a bull market:
Firstly, the efficiency of industrialization is too high, leading to excessive competition and reducing ROE, shortening product lifecycles
The efficiency of Chinese enterprises in industrialization is too high:
- They tend to swarm into new technologies and products, making large-scale investments that lower profit margins and ROE, quickly leading to overcapacity. For example, in just a few years, photovoltaic, wind power, lithium battery, and new energy vehicle enterprises have sprung up across the country, resulting in a short-term surge in performance followed by overcapacity and collective losses.
- They quickly saturate the market with products, rapidly increasing penetration rates. Market promotion that might have taken ten years could be completed in three years. For example, leading companies in photovoltaics, wind power, and new energy vehicles, driven by policies, quickly push into the market, increasing penetration rates.
This is reflected in stock prices as short-term valuations reaching 80 to over 100 times, with stock prices skyrocketing; subsequently, as penetration rates quickly rise to 30%, 50%, the expected future performance growth rate declines, causing stock prices to plummet. A potential slow bull market that could last ten years or more gets completed in 2-3 years, followed by a sharp drop.
Secondly, investor behavior
Due to the reasons mentioned above, investors are reluctant to hold tech stocks for the long term (fearing roller coaster rides), preferring trend investing over long-term holding. This leads to:
- When hot industries and companies emerge, investors rush in, causing stock prices to soar in the short term; then they sell off en masse, causing prices to plummet.
- During the rise of tech stocks, they have high hopes and assign extremely high PE, PB, or PS ratios; during the decline, they overreact and oversell.
Thirdly, issues with index weights
As of the end of November 2023, the weight of information technology in the NASDAQ index, the Korea Composite Index, and the Taiwan Weighted Index is far higher than in A-shares. Information technology accounts for 19.91% of the GEM index, 30.3% of the GEM Composite Index, and only 12.04% of the Shanghai Composite Index. In contrast, the weight of information technology in the NASDAQ is 61.51%, 59.3% in the Taiwan Weighted Index, and 39.5% in the Korea Composite Index.
The Shanghai Composite Index and Wind All-A have high weights in finance, industry, and cyclical sectors, which indeed reflect the objective situation of China’s low TFP growth rate. Thus, it is normal for the Shanghai Composite Index to find it difficult to break away from 3000 points for the long term. If it continues to rise, it would be counterintuitive because it would violate economic laws.
(3) “Besieged Stage”, The A-Share Market Will Lack Good Investment Opportunities for a Long Time
As China’s economy enters the “besieged stage”:
【1】Investment returns will continue to decline, and companies will inevitably become more internally competitive to vie for profits.
【2】As economic growth slows down, the growth rate of scientific research investment also declines, and the pace of technological progress will slow down, further suppressing the natural interest rate.
【3】Population aging will become increasingly severe.
【4】The reform process is slow.
Therefore, it will be more difficult to improve TFP and the natural interest rate in the future.
Since the beginning of 2024, regulatory authorities have been vigorously strengthening regulations and cracking down on illegal micro-behaviors, leading to a rebound in the Shanghai Composite Index from February to mid-May 2024 and in the ChiNext Index from February to mid-March 2024. Moreover, there seems to be a social atmosphere that attributes the stock market decline to financial practitioners, suggesting that if these individuals are dealt with, a bull market will emerge. This is actually a populist idea. The most fundamental factors determining the stock market are neither financial practitioners nor regulatory actions, but the growth rate of TFP and the natural interest rate. Without improvement in TFP and the natural interest rate, the A-share market will lack decent investment opportunities for a long time.
(4) Potential Investment Themes
First, the concept of low volatility dividends, similar to utility industries. Look for stocks with high dividends, high yields, and low valuations. Some central and state-owned enterprises can also be included in this category.
Second, new quality productivity. Look for stocks with high technical barriers, large market potential, and broad prospects. However, many industries (such as artificial intelligence, humanoid robots, hydrogen energy vehicles, controllable nuclear fusion, brain science, brain-computer interfaces, future displays, etc.) either lack widely accepted flagship products or are in the early stages of development and may not show performance in the short term, thus remaining primarily speculative themes.
Third, the concept of going global. However, currently, Chinese companies face entirely different market space, political environment, and competitive environment compared to Japanese companies going global 30 years ago, requiring careful identification.
Fourth, opportunities brought by rising total demand. However, as mentioned earlier, it is difficult for China to experience a standard inventory cycle in the future, and the rebound in the growth rate of total demand will be very weak, making it difficult to find investment opportunities from this perspective.
(5) Long-term Positive Outlook on the Bond Market
As previously mentioned, in the long term, China’s long-term bond yields will decline to 0 or even negative values, so the bond market can be viewed positively for the long term.
VIII. Policy Recommendations: Strive to Delay the Decline in Investment Returns
(1) Short-term Demand Management Policies
The central bank should significantly lower the nominal interest rate by at least 70 basis points to equalize the real interest rate with the natural interest rate, thereby restoring the neutral or accommodative stance of monetary policy.
Do not attempt to raise long-term bond yields, as it is both unachievable and detrimental. It is recommended to maintain low long-term bond yields so that residents, enterprises, and the government can convert previous high-interest debt into low-interest debt, improving their balance sheets, which is a prerequisite for economic recovery.
The central bank should quickly participate in government bond trading to gain experience for QE; monetize deficits when necessary.
Do not overly emphasize external balance. Allow for greater depreciation of the exchange rate when necessary.
The fiscal department should dare to significantly leverage up, raising the fiscal deficit to (for example) 6% or even higher. Issue special government bonds:
【1】The central government should lead investments in key national projects, especially research and development projects, to quickly resolve the issues where China is technologically blocked by the West;
【2】Establish industrial funds (similar to the semiconductor big fund) to vigorously develop new quality productivity, such as AI, humanoid robots, brain science, etc., ensuring not to fall behind in the technological competition with the United States.
【3】Reduce taxes for specific households, or even distribute cash to stimulate consumption;
【4】Strengthen policy coordination among various government departments, prohibiting the implementation of contractionary policies.
(2) Long-term Fundamental Solutions (Supply-side Policies)
Since the root cause of China’s economic problems is the decline in investment returns due to real factors, the fundamental solution is to address these real factors to delay the decline in TFP growth and the natural interest rate. This includes two aspects: reform and innovation.
Reform all systems and mechanisms that hinder technological progress. For example: promote the closure of zombie enterprises; prohibit discriminatory policies against the private economy, ensuring they enjoy the same treatment as state-owned enterprises in financing, market access, etc.; reform distribution systems and fiscal systems, and release institutional dividends.
Reform all systems and mechanisms that hinder innovation. For example, reform the scientific research system, education system, integration of production and finance, intellectual property system, business environment, etc., to cultivate an innovation-friendly environment.
Streamline government personnel. Abolish government activities that do not improve economic efficiency, reduce personnel supported by fiscal expenditures; cut government spending that does not produce effectiveness.
Stop unnecessary government intervention in the market and industries, allowing the market to play a fundamental and decisive role in resource allocation.
Reform population policies, ethnic policies, and religious policies. Abolish ethnic distinctions, having only one nationality nationwide, encouraging intermarriage and integration. Abolish reverse nationalism policies, especially discriminatory policies against the Han nationality, ensuring equality for all. This is the fundamental guarantee for long-term stability.
Reform and innovation should not remain on paper but be implemented in practice. Effectively improve TFP growth and delay the decline of the natural interest rate through reform and encouragement of innovation. Especially in emerging technological fields (such as AI), China must not lag behind the United States, seizing every opportunity to improve productivity.
IX. Advice for Ordinary People
Finally, I want to give a few pieces of advice to ordinary people like myself:
The economic growth of China over the past 40-plus years has been a miracle in human history. It was brought about by the institutional dividends, demographic dividends, and broad-based technological progress unleashed by reforms. Ordinary people like us happened to live in this era and, through our efforts, shared the benefits of economic development. However, miracles are always short-lived, and prosperity will eventually fade away. Such a large economy cannot maintain a “golden age” forever. “Besieged” and “being chased” is the norm. Understanding the characteristics of this historical stage can help us make better choices.
First, we must always maintain the ability to learn. Learning can improve our skills, adapt to industrial changes, and withstand the impact of the times. Learning can also enhance our cognitive and discernment abilities, helping us avoid pitfalls and risks in times of economic downturn, which is a victory in itself.
Second, do not easily invest in equities and commodities, including speculating in stocks, buying stock funds, or starting your own business (as a shareholder). In the face of long-term deflationary pressure, preserving cash and lowering return expectations is a victory.
Third, although individual efforts may seem insignificant in the face of historical trends, life should not be wasted in passivity and self-abandonment. At any time, we must maintain a strong inner self and never give up hope.
Finally, let me end this article with the last sentence of the novel “Gone With the Wind”:
Tomorrow is another day!
References (only citing the directly referenced works in the text, more references can be found by clicking the hyperlinks in the text)
Guchao Ming, translated by Yu Haixiang, “The Great Recession,” Oriental Publishing House, November 2008.
Guchao Ming, translated by Xu Zhong and Ren Qing, “The Pursued Economy,” CITIC Publishing Group Co., Ltd., November 2023.
Lewis, Arthur, 1954, “Economic Development with Unlimited Supplies of Labor,” Manchester School, Vol. 22, No. 2, 139—191.
Yi Gang, “China’s Interest Rate System and Interest Rate Market Reform,” “Financial Research,” Issue 9, 2021.
Yi Gang, “Autonomy and Effectiveness of Monetary Policy and Economic and Financial Stability,” “Economic Research,” Issue 6, 2023.
Sun Guofeng, Daniel M. Rees, “China’s Natural Interest Rate,” PBOC Monetary Policy Committee Discussion Paper No. 2021/01.
Phelps, Edmund. “The Golden Rule of Accumulation: A Fable for Growthmen,” The American Economic Review, Vol. 51, No. 4 (Sep., 1961), pp. 638-643.
Edmund Phelps, translated by Zhang Yanren, “The Golden Rule of Economic Growth,” Mechanical Industry Press, 2015.
Minami, Ryoshin, 1968, “The Turning Point in the Japanese Economy,” Quarterly Journal of Economics, 82 (3), 380—402.
Liu He, editor, “A Comparative Study of Two Global Crises,” China Economic Publishing House, February 2013.
Related Content
- Shen Kui & Lao Dongyan | Opinions on "Net Certificate and Net ID"
- State of Play in China:Why the CCP Desperately Wants to Reclaim Li Rui's Diary Rights? (Part 2)
- State of Play in China:Why the CCP Desperately Wants to Reclaim Li Rui's Diary Rights? (Part 1)
- Why Are So Many People Homeless?
- Homelessness in America:Statistics, Analysis, and Trends